Multiple Regression Analysis: Estimation and Inference
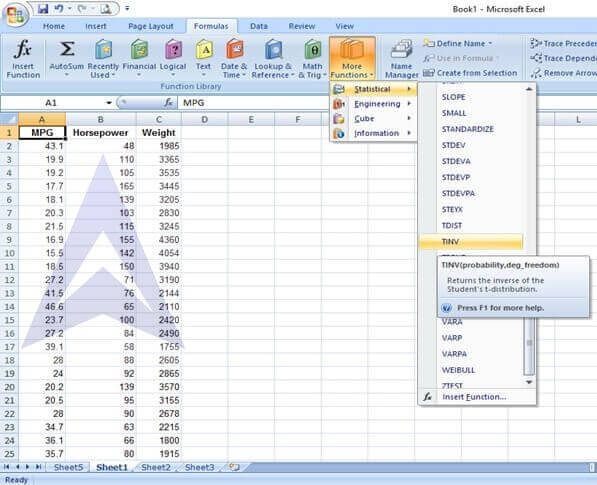
A consumer organization wants to develop a regression model to predict mileage (as measured by miles per gallon) based on the horsepower of the car’s engine and the weight of the car (in pounds). Data were collected from a sample of 50 recent car models, and the results are organized and stored in Auto.
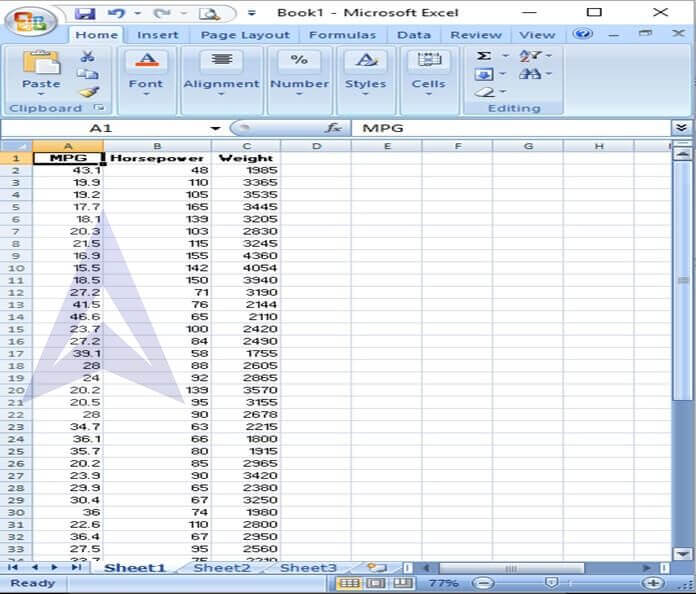
Step 1: Copy the data from the word file and paste it into an Excel worksheet.
| MPG | Horsepower | Weight |
|---|---|---|
| 43.1 | 48 | 1995 |
| 19.9 | 110 | 3365 |
| 19.2 | 105 | 3535 |
| 17.7 | 165 | 3445 |
| 18.1 | 139 | 3205 |
| 20.3 | 103 | 2830 |
| 21.5 | 115 | 3245 |
| 16.9 | 155 | 4360 |
| 15.5 | 142 | 4054 |
| 18.5 | 150 | 3940 |
| 27.2 | 71 | 3190 |
| 41.5 | 76 | 2144 |
| 46.6 | 65 | 2110 |
| 23.7 | 100 | 2420 |
| 27.2 | 84 | 2490 |
| 39.1 | 58 | 1755 |
| 28 | 88 | 2605 |
| 24 | 92 | 2865 |
| 20.2 | 139 | 3570 |
| 20.5 | 95 | 3155 |
| 28 | 90 | 2678 |
| 34.7 | 63 | 2215 |
| 36.1 | 66 | 1800 |
| 35.7 | 80 | 1915 |
| 20.2 | 85 | 2965 |
| 23.9 | 90 | 3420 |
| 29.9 | 65 | 2380 |
| 30.4 | 67 | 3250 |
| 36 | 74 | 1980 |
| 22.6 | 110 | 2800 |
| 36.4 | 67 | 2950 |
| 27.5 | 95 | 2560 |
| 33.7 | 75 | 2210 |
| 44.6 | 67 | 1850 |
| 32.9 | 100 | 2615 |
| 38 | 67 | 1965 |
| 24.2 | 120 | 2930 |
| 38.1 | 60 | 1968 |
| 39.4 | 70 | 2070 |
| 25.4 | 116 | 2900 |
| 31.3 | 75 | 2542 |
| 34.1 | 68 | 1985 |
| 34 | 88 | 2395 |
| 31 | 82 | 2720 |
| 27.4 | 80 | 2670 |
| 22.3 | 88 | 2890 |
| 28 | 79 | 2625 |
| 17.6 | 85 | 3465 |
| 34.4 | 65 | 3465 |
| 20.6 | 105 | 3380 |
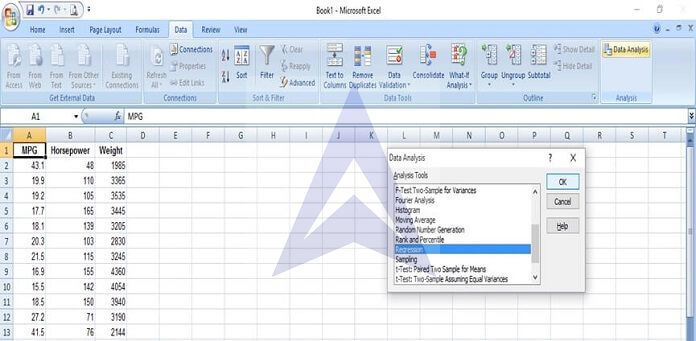
Step 2: Go to the Data thread and select the option – Data Analysis. From the data analysis dialog box, select the option – Regression.
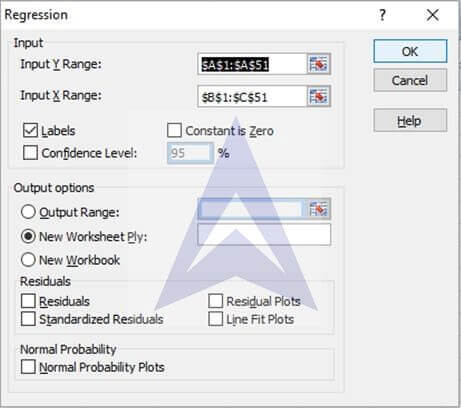
Step 3: select cells A1 to A51 in the input y range and cells B1 to C51 in the input x range. Select the option of labels and set the confidence level at 95%. Select ‘New Worksheet Ply’ from the Output options. Click on Ok. The regression output will instantly display in a new worksheet.
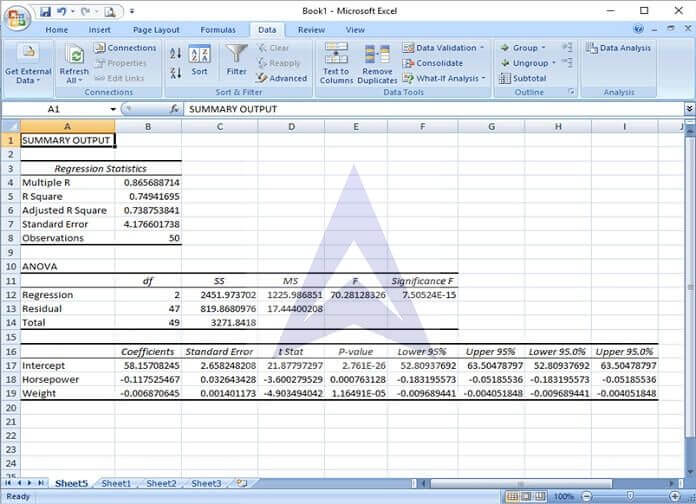
A. State the multiple regression equation
From the coefficients provided in the regression results, the regression equation is: MPG = 58.16 – 0.11 b1– 0.007 b2
{`
  Here, b0 = intercept
  b1 = Horsepower of engine
  b2 = Weight
  `}
B. Interpret the meaning of the slopes, b¹ and b² in this problem
The slope b1 shows that with an increase of 1 horsepower in the engine, the mileage of the car decreases by 0.11 miles per gallon and vice versa.
The slope b2 shows that with an increase of 1 pound in the cars weight, its mileage will fall by 0.007 miles per gallon and vice versa.
Thus, it can be concluded that both, the horsepower of the car’s engine and the weight of the car are inversely related to its mileage.
C. Explain why the regression coefficient, bº, has no practical meaning in the context of this problem
The intercept b0 has no practical implication as the miles that a car will travel will not have a fixed minimum level beyond which it will depend on the horsepower of the engine and the car weight. This statement does not have any practical basis.
D. Predict the mile per gallon for cars that have 60 horsepower and weigh 2,000 pounds
{`
  b1 = 60
  b^2 = 2000
  Hence, the miles per gallon (MPG) will be:
  MPG= 58.16 – (0.11*60) – (0.007*2000) = 37.56
  Therefore, the miles per gallon will be 37.56
  `}
E. Construct a 95% confidence interval estimate for the mean miles per gallon for cars that have 60 horsepower and weigh 2,000 pounds
{`
  The confidence interval will be:
  Y = MPG ± tn-2,α/2 *sMPG
  To calculatetn-2,α/2, select the TINV function in Excel (Formulas -> More Functions -> Statistical -> TINV)
  `}
In the TINV dialog box,
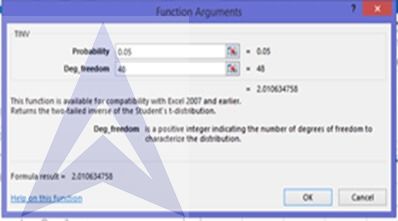
{`
  Thus, we get the value of tα/2 as 2.01
  sMPG = 4.176 (from the regression results)
  Confidence interval = 37.56 ± (2.01*4.176) = (29.16, 45.95)
  `}
F. Construct a 95% prediction interval for the miles per gallon for an individual car that has 60 horsepower and weighs 2,000 pounds
{`
  The prediction interval will be:
  Y = MPG ± t48,0.05*√sMPG2 + MSE
  MSE = 17.44 (from the regression results)
  Y = 37.56 ± (2.01*√4.1762+17.44) = (25.70, 49.30)
  `}
Excel Econometrics Tutorials
Multiple Regression Analysis
- Estimation and Inference
- Estimation, Inference & Prediction
- Model Formation: Checking Significance of Independent Variables
Time Series Analysis
- Exponential Smoothing Forecasting
- Plotting Linear Trend and Forecasting
- Monthly Data De-Trending, Seasonal Index & Forecasting
- Linear, Exponential and Quadratic Trend
- Excel Tutorial for Normal Distributions
Data Analysis


