Accounting Assignment Help With Graphical Presentation of BEP
1.2 Graphical Presentation of BEP
In the figure, Horizontal axis measures output in units and the vertical axis measures sales and costs. Sales line ( os ) is an upward rising straight line. This is because sales increase with production. OA is fixed cost which maintained within the given range of output.

Total Costs = Fixed Costs + Variable Costs
So, total costs line (AT) starts from A. It means even if output is zero and you are at point O, still you have to incur fixed costs of OA. Thus AT represents total costs line. OS represents sales line. OS and OT intersect at point P. It is breakeven point. BP represents both total costs and sales at breakeven point.
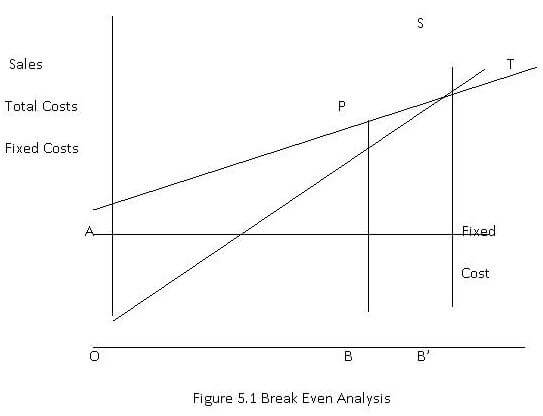
Illustration 1:
Assam Pharmaceutical Ltd. Manufactured 26000 lakhs tablets and capsules for Rs 2860 crore. Its coat of sales and profit analysis is gven below :
$ Crore Per unit
| Direct material | 785 | 3.02 |
| Direct wages | 312 | 1.2 |
| Direct Expenses | 212 | .82 |
| Prime cost | 1309 | 5.03 |
| Manufacturing overhead ( 60% variable ) | 300 | 1.15 |
| Administrative Overhead ( 100% fixed ) | 400 | 1.54 |
| Selling & distribution Overhead ( 30% variable ) | 300 | 1.15 |
| R & D – Amortisation | 200 | .77 |
| Total cost | 2509 | 9.65 |
| Profit | 351 | 1.35 |
| Sales | 2860 | 11.00 |
The company was operating at 60 % capacity.
Find out BEP & margin of safety?
The company was considering a proposal to operate at 75% capacity level. Since the fixed cost is step cost in nature, a proper analysis has been made on the behaviour of fixed cost. It is projected that fixed cost (expecting R & D cost ) would increases @ 5 % for every 10% capacity utilisation above 60 %. However, the additional production can be sold only at 20% discount. Apply marginal cost analysis explain whether additional production and sales should be carried out.
Solution:
Break even and margin of safety analysis
| $ In crore | Per unit | |
| Sales | 2860 | 11.00 |
| Variable cost : | ||
| Direct material | 785 | 3.02 |
| Direct wages | 312 | 1.2 |
| Direct expenses | 212 | .82 |
| Manufacturing overhead | 180 | .69 |
| Selling & administration overhead | 90 | .35 |
| Selling & administration overhead | 90 | .35 |
| 1579 | 6.07 | |
| Contribution | 1281 | 4.93 |
| P/V ratio (%) | 44.79 |
Fixed cost
| Manufacturing overhead | 120 |
| Selling & administration overhead | 210 |
| Administration overhead | 400 |
| R&D – amortisation | 200 |
| 930 | |
| BEP ( units in crore ) ( fixed cost/ contribution per unit ) | 188.76 |
| BEP ( in value ) ( fixed cost/ P/V ratio ) | 2076.35 |
| Margin of safety | 783.65 |
| Margin of safety(%) | 37.74 |
Email Based Homework Help in Graphical Presentation of BEP
Following are some of the topics in Marginal Costing in which we provide help:
Accounting Assignment Help | Accounting Homework help | Help with Accounting | Management Accounting | Cost Accounting | Online Tutoring | Financial Accounting | Email Based Accounting Homework Help


