AQA AS ECONOMICS 2015: Unit 1 Markets and Market Failure
Section A: Objective Test
Q.1. A production possibility frontier illustrates
- A. the various combinations of output an economy will produce with its limited resources.
- B. the various combinations of output an economy is currently capable of producing with its limited resources.
- C. the maximum output an economy will ever be capable of producing.
- D. the various combinations of output which can be produced at zero opportunity cost to society.
Answer: B - A production possibility frontier refers to the graphical representation of the various combinations of two goods which an economy can produce given the availability of necessary resources and technology. PPF represents alternative production possibilities of two goods open to an economy in the current availability of limited resources and technology.
Q. 2. Which one of the following would be classified by an economist as an example of the factor of production known as capital?
- A. A delivery van
- B. Stocks and shares C
- C. Savings in the bank
- D. Underground reserves of coal
Answer: A- Delivery van will be classified as a capital. Capital refers to anything produced to be used further in production of goods and services. A delivery van is a capital good produced to increase the productive capacity of a business by providing distribution (of raw materials or finished goods) services.
Q.3. Which one of the following combinations, A, B, C or D, correctly identifies the operation of both the rationing and incentive functions of the price mechanism?
| Price change | Rationing function | Incentive function | |
|---|---|---|---|
| A | Rise | More supplied | Less demanded |
| B | Fall | More supplied | More demanded |
| C | Rise | Less demanded | More supplied |
| D | Fall | More demanded | More supplied |
Answer: C- The interaction of buyers (demanders) and sellers (suppliers) in a free market help in efficient allocation of resources.
Whenever there is scarcity of a good (or say resource), then demand exceeds the supply of that good. This drives the price up in order to discourage demand. In other words, greater the scarcity (demand>supply), higher the price and thus more resources are rationed (contraction of demand by higher price). Higher price provide incentive to the producers (or sellers) to supply because of increased profitability. Thus, we infer the following result:
PRICE RISE— LESS GOOD DEMANDED (rationing function) ̶MORE SUPPLIED (incentive function).
Q. 4. The diagram below shows the supply of, and demand for, milk with the initial price at OP. A government now decides to impose a maximum price of Pmax.
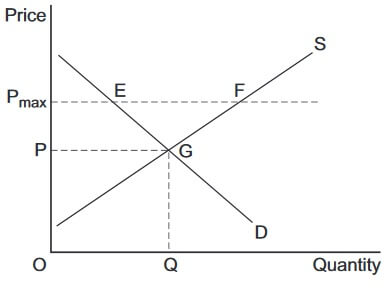
The most likely outcome would be
- A. excess supply of milk at EF.
- B. a shortage of milk at EF.
- C. the equilibrium price OP being maintained.
- D. a reduction in price from Pmax to OP.
Answer: C- The equilibrium price of OP will be maintained. Here, we have a situation of Price ceiling. Price ceiling refers to the maximum price that is imposed by the government at a level lower than the equilibrium price (OP).Here, the price ceiling is not binding as the maximum price fixed is above the equilibrium price. The price ceiling above the price level realized by the market has no effect as the market will equate supply and demand and thus equilibrium price will be maintained.
Q. 5. The demand for capital goods such as plant and machinery is said to be an example of derived demand because the demand for capital goods depends on
- A. the productivity of capital goods.
- B. the volume of consumer goods purchased.
- C. the price of capital goods.
- D. the amount of labour employed by a firm.
Answer: B- The demand for capital good is a derived demand. It is determined by the volume of final consumer goods sold. The demand for capital good is directly related to the demand for the final good. If the demand for final good rises then the amount of plant and machinery required to produce that good also rises.
Q. 6. Which one of the following is the most likely reason for government intervention in a market to correct a misallocation of resources?
- A. A low price elasticity of supply of a good
- B. Immobility of factors of production
- C. Diseconomies of scale in production of a good
- D. An excess market demand for a good
Answer: B- Factor immobility occurs when it is difficult for the factors of production to move between different expanse of the economy. There are two types of market factor immobility, occupational immobility and graphical immobility. Occupational immobility occurs when there are barriers to the movement of factors of production (labor and capital) between different sectors of the economy. This leads to these factors remaining unused or unemployed. People experience occupational immobility because of a mismatch between the skill that an unemployed has and the skill that the employer is looking for.
Geographical immobility refers to a situation resources especially labor do not freely move from one location to another. This refers to the barriers that prevent people from moving from one place to other to find work.
Government can improve or make changes in the country’s education system by introducing new Assignments (or remolding existing ones) that cater to the needs of the economy
Q. 7. The table below shows changes in labour productivity for a firm over time.
| Year | Index of labour productivity (2010 = 100) |
|---|---|
| 2008 | 110 |
| 2009 | 103 |
| 2010 | 100 |
| 2011 | 102 |
| 2012 | 111 |
The data show that over the period 2008 to 2012
- A. the total output of all workers was highest in 2012.
- B. productivity changed at its fastest rate between 2008 and 2009.
- C. the numbers of workers employed was higher in 2012 than in 2010.
- D. the amount produced per worker rose fastest between 2011 and 2012.
Answer: D- Labor productivity= Total output/total labor. Labor productivity measures the amount of goods and services produced by a worker per unit of time. Labor productivity is a measure of a country’s output efficiency. According to the table, the output worker rose from 100 to 102 between 2010-2011. It rose the fastest from 102 to 111 between 2011 and 2012. Higher labor productivity does not necessarily imply higher output. It may also imply that the same output is being maintained while reducing the level of inputs (labor).
Q. 8. The table below shows values of income elasticities of demand for four goods, W, X, Y and Z.
| Good | Estimate of income elasticity of demand |
|---|---|
| W | +0.52 |
| X | +0.61 |
| Y | −0.49 |
| Z | −0.57 |
From the table, it may be concluded that
- A. the demand for all four goods is price inelastic.
- B. the cross price elasticity of demand between Good X and Good W is positive.
- C. as incomes rise, the demand for Good Y and Good Z will rise, but by a smaller percentage.
- D. as incomes fall, only the demand for Good Y and Good Z will rise.
Answer: D- As income fall, only the demand for good Y and Z will rise. Income elasticity of demand refers to the responsiveness of the quantity demanded of a good or service to a change in the income of the people.
Negative income elasticity of demand means that an increase in the income of the people will result in the fall in the demand of the good as they switch to better substitutes. Positive income elasticity of demand means that an increase in the income of the people will lead to a rise in the demand of the good. Here, good W and X have positive income elasticity of demand which means that a fall in income will result in a fall in demand of the goods W and X. on the other hand goods Y and Z have negative income elasticities which means that when income falls, the demand for these goods will rise.
Q. 9. The diagram below shows the marginal private benefit (MPB) and marginal social benefit (MSB) curves and the marginal private cost (MPC) and marginal social cost (MSC) curves for Good X produced by a firm. The free market equilibrium position is at point J.

Which one of the following government policies should be used to correct the market failure that exists at point J?
- A. A per unit subsidy of FH
- B. A per unit tax of FG
- C. A per unit subsidy of EG
- D. A per unit tax of EG
Answer: D- From the diagram, we can clearly infer that we have a case of negative externality where marginal private cost (cost to the producer due to employment of additional input) is less than the marginal social cost (the cost to the society for every additional unit produced by the producer) leading to a deadweight loss of EJH. Thus, per unit tax of EG must be charged from the producer to make them pay the full social cost of the good. The per unit tax increases the marginal private cost. The tax is charged for every unit until MPC=MSC.
Q.10. In February 2011, British Gas announced record profits for the second year in a row from supplying gas to UK households. Just months after these record profits, British Gas announced price rises of 18%. The increase in price makes it more likely that British Gas has been exploiting its monopoly power.
From the data given, which one of the following is most likely to be correct?
- A. The 18% price rise is an example of a barrier to entry into the market.
- B. British Gas is efficient because it made record profits in the two years leading up to February 2011.
- C. The gas supplied by British Gas has positive externalities in consumption.
- D. There is a high degree of concentration in the UK market for gas supplied to households.
Answer: D- There is high degree of concentration in the UK market for gas supplied to households.
Market concentration refers to the extent to which sales in a market are dominated by one or two business. High degree of market concentration leads to a monopolistic or oligopolistic market structure.
Increase in prices by 18% makes it clear that the British gas is exploiting its monopoly powers. British gas enjoys high amount of market concentration which makes it a price setter in the UK gas market.
Q. 11. A pure public good is always
- A. provided by the government for all consumers.
- B. provided free of charge because there is no opportunity cost.
- C. available for consumption by others when consumed by an additional person.
- D. heavily subsidised by the government.
Answer: C- A pure public good is always available for consumption by others when consumed by an additional person.
A public good is a non- excludable and a non-rivalrous good. In economics, a good or a service is non-excludable when it is not possible to prevent people who have not paid for it from having access to it. A good or service is non-rivalrous if its consumption by one consumer do not prevent simultaneous consumption by any other consumer.
Q. 12. The natural environment in the UK is under threat from urbanisation as more and more new houses are built on unspoilt countryside. It has been estimated that by 2050 a fifth of England could be urbanised.
From the passage above, it can be inferred that
- A. the natural environment is an economic resource.
- B. the opportunity cost of land is zero.
- C. the price of land for house building is lower than the price of land for farming.
- D. the private cost of urbanisation is greater than its social cost.
Answer: A- A natural environment of a country is its economic resource. Natural resource economics focuses on the demand, supply, and allocation of the earth’s scarce natural resources efficiently. Natural resources are important economic assets. A country rich in natural resources enjoy easy availability of natural raw materials required in the production of various goods having great economic value.
Q. 13. Which one of the following combinations, A, B, C or D, is true for a normal good which has a downward sloping demand curve?
| Income elasticity of demand | Price elasticity of demand | |
|---|---|---|
| A | Positive | Positive |
| B | Positive | Negative |
| C | Negative | Negative |
| D | Negative | Positive |
Answer: B- Normal goods have positive income elasticity of demand and negative price elasticity of demand.
In economics, normal goods refer to those goods, the demand for which rises with rise in income and falls with fall in the income of the consumer (assuming price remains constant). In other words, normal goods have positive income elasticity of demand.
Price elasticity of demand refers to the responsiveness of quantity demanded to changes in the price of the good, ceteris paribus.
Price elasticities are always negative, confirming to the law of demand, except for Giffen goods. Negative price elasticities mean that the demand of a good falls when the price of that good rises and demand rise when the price fall.
Q.14. A government subsidy would cause the largest fall in the price of a product if its price elasticity of demand (defined as a positive number) were
- A. less than 1.
- B. 1.
- C. greater than 1.
- D. infinity.
Answer: A government subsidy would cause largest fall in the price of a product if the price elasticity of that product is less than 1. When the price elasticity is less than 1, then a fall in the price increases the demand less proportionately. So in order to increase consumer demand by larger amount, the government will have to decrease the prices by larger amount. This means the government will have to provide large amount of subsidy.
Q. 15. The diagram below shows the market for Good X.
Which one of the following would cause a rightward shift of the supply curve from S1 to S2?
- A. An increase in the demand for Good X
- B. The creation of a monopoly by the firms in the industry supplying Good X
- C. A reduction in the rate of Value Added Tax (VAT) applied to Good X
- D. A decrease in the cost of the raw materials used in the production of a substitute good
Answer: C- The reduction in value added tax (VAT) on good x will shift the supply of the good X rightwards.
Value added tax raises the input costs faced by the producers. So, when the VAT charged decreases, the input cost faced by the producer thus leading to increased supply. For the demand remaining unchanged, higher supply lowers the price of the Good X. the producer passes on the benefit of lower input costs to the consumers in the form of low VAT by reducing the prices.
Q. 16. Which one of the following is associated with a missing market?
- A. A monopoly restricting output
- B. The production of a negative externality C
- C. firm deciding to produce a private good
- D. government subsidising agricultural production
Answer: B- Negative externality refers to the cost suffered by a third party as a result of an economic transactions. The most important feature of any externality, be it positive or negative, is that they do not have markets. Example: A firm produces a product and dumbs the waste into the river (causing water pollution) which affects many fisheries located down the river stream. This is a case of negative production externality where pollution is a good which is a concern for the fisheries. However, there is no market for the pollution. This lack of market for externalities lead to many serious problems when there are no defined property rights.
Q. 17. A market is defined as being in equilibrium when
- A. there is maximum output at minimum cost.
- B. prices are at their lowest possible level.
- C. there is no tendency for the market price to change.
- D. consumer satisfaction is maximised.
Answer: C- A market is defined to be in equilibrium when there is no tendency for the market price to change.
Market equilibrium occurs when quantity demanded equals supply. At market equilibrium, price is such that the market clears.
When quantity Demanded>quantity supplied: In this situation market price is below the equilibrium price. There is shortage of Good X in the economy which will drive prices up due to competition among consumers to buy the limited quantities of the Good X. This will continue until the price reaches equilibrium level (P) again. Thus, market will again reach equilibrium point (E) where demand=supply.
When quantity Supplied >quantity demanded: In this situation, the market price is above the equilibrium price (P). The market is in surplus for Good X which will result in fall in prices due to competition among sellers to sell their produce. This process will continue until the equilibrium level of quantity and price (at Q and P respectively) is achieved.
Q. 18. In the diagrams below, S1 and D1 show the original supply and demand curves for Good X, while S2 and D2 show shifts of these curves. Which diagram, A, B, C or D, illustrates the effects of an increase in the price of a good that is complementary to Good X and an increase in labour productivity in the production of Good X?
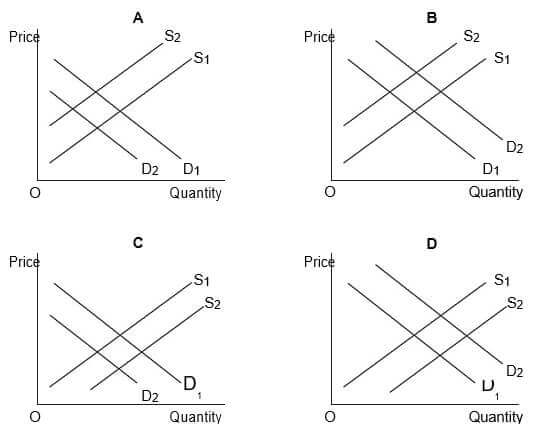
Answer: C- Complementary goods refer to those goods which have to be consumed together in order to satisfy a single want. Example: car and petrol.
An increase in the price of a complementary good (say, petrol) will reduce the demand for Good X (car) as increase in the complementary good (petrol) makes it expensive for the consumer to buy good X (car) as both have to be consumed together. As a result, the demand curve shifts leftwards from D1 to D2.
Now an increase in labor productivity means that there is increase in the efficiency of the labor in terms of output produced per unit of time. This leads to shift in the supply curve towards right from S1 to S2.
Q. 19. The price elasticity of demand for a good made by a firm is −0.6. If the firm raises the price of the good, its revenues will
- A. rise.
- B. stay the same.
- C. fall by more than 6 per cent.
- D. fall by less than 6 per cent.
Answer: A- The price elasticity of -0.6 imply that if price of a good increases by 1% then the quantity demanded for that good will fall only by 0.6%. this means that increase in price reduces the demand by relatively less proportions.
Revenue = (Price)*(quantity)
Now, as the price increases then the quantity reduces by les proportions which makes it clear that the revenue of the firm rises.
Q. 20. Specialisation and the division of labour require
- A. firms to be productively efficient.
- B. the economy to be on its production possibility boundary.
- C. a means of exchanging goods and services.
- D. competitive markets.
Answer: C- In economics, specialization refers to a situation where individuals and firms, regions and nations (who are willing to trade with other nations) concentrate upon producing some goods and services rather than others.
Division of labor refers to the separation of tasks in an economic system so that the participants can specialize. Specialization and division of labor requires a means of exchange of goods and services. For example: countries that do not produce a particular good X can acquire it from other nation through trade. Rather than producing Good X, it can concentrate or say specialize in the production of any other good which they can produce efficiently. This will help in dealing with the problem of scarcity in individual countries.
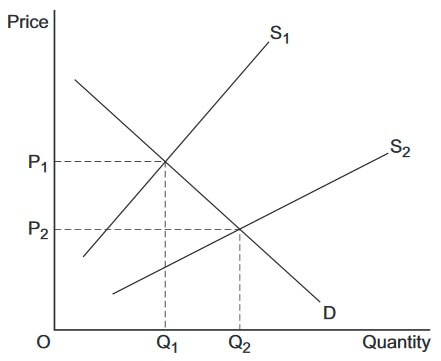
Q. 21. The diagram below shows the demand and supply curves for sugar in an economy.
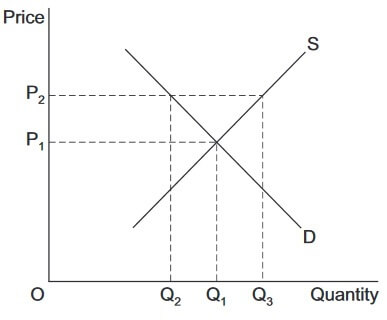
The free market price of sugar is OP1. The government has decided to maintain a price of OP2 and to do so through intervention buying. In achieving a price of OP2, the amount spent on intervention buying by the government would be
- A. OP1 x OQ1
- B. OP2 x OQ2
- C. OP2 x Q2Q3
- D. OP2 x OQ3
Answer: c- Here, the government has set the minimum price of sugar at OP2. This is a case of binding price floor. At price OP2 (which is above the equilibrium price OP1), there is excess supply of sugar in the economy by the amount Q2Q3. Now the government indulges in intervention buying where it buys all the surplus amount Q2Q3 in order to achieve the price level OP2.
Thus, the amount that will be spent on intervention buying isOP2× Q2Q3.
Q. 22. Public goods result in market failure because
- A. in the absence of government intervention, a working market for the product is unlikely to become established.
- B. pure public goods are both rival and excludable.
- C. the positive externalities in consumption exceed the private benefits.
- D. the marginal social cost of providing public goods exceeds the marginal social benefit.
Answer: A- Public goods result in market failure because in the absence of government intervention, a working market for the product is unlikely to become established.
Public goods are non-excludable and non-rivalrous. In economics, a good or a service is non-excludable when it is not possible to prevent people who have not paid for it from having access to it. A good or service is non-rivalrous if its consumption by one consumer do not prevent simultaneous consumption by any other consumer.
A good has a market because firms want to sell that good in order to make profit. However, as public goods are non-excludable and non-rivalrous, the marginal cost (MC) of the public good is $0 which means the firm has to set the price equal to $0 (assuming perfect competition, where efficient allocation of goods take place when P=MC). Thus, in the absence of government, free market forces would fail to provide the good as no one will sell a good free of cost.
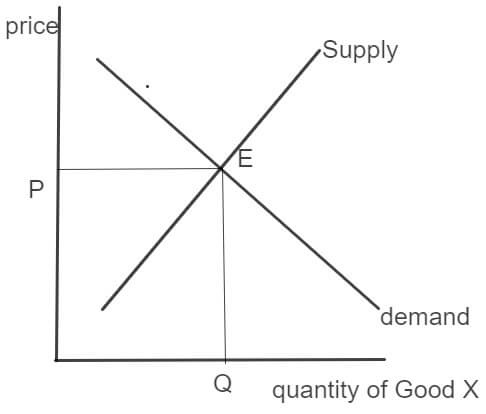
Q. 23. In the diagram below, the government grants a subsidy to manufacturers of loft insulation. This shifts the market supply curve from S1 to S2.
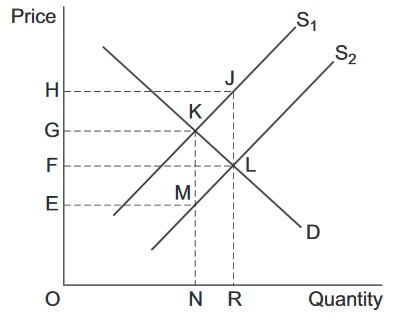
The total amount spent by the government on subsidies is represented by the area
- A. OHJR.
- B. FHJL.
- C. OFLR.
- D. EGKM.
Answer: B- The government subsidy leads to a rightward shift in the supply curve from S1 to S2 leading to lower equilibrium price (F). The amount of subsidy is shown by vertical distance JL. Thus, amount spent by the government on the subsidy, to reduce the equilibrium level of price to F, is FHJL.
Q. 24. A firm is productively inefficient if
- A. it can lower its average cost of production by reducing its output.
- B. an increase or a decrease in output will lead to a rise in its average cost of production.
- C. it can increase labour productivity by increasing the amount of capital it employs.
- D. the price it has to pay for raw materials and components is increasing.
Answer: A- The MC curve always intersect the AC at the minimum. When the marginal cost is greater than the average cost, MC pulls the average cost up which is shown as a rising AC. When MC is the less than the AC, MC pulls the AC down which is shown as a falling AC. Now when MC is equal to AC, then AC does not change and hence it is at its minimum.
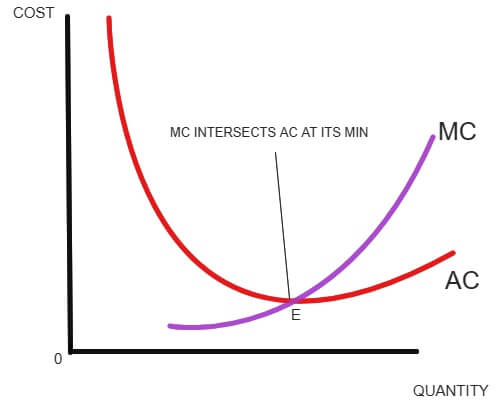
Thus, a firm will produce efficiently till its marginal cost (MC) is equal to the average cost (AC). So, if a firm is able to reduce cost by producing additional unit, then it is profitable to produce more until MC=AC. If further production takes place, then average cost will increase.
25. All other things being equal, in a monopoly
- A. market power always leads to an efficient allocation of resources.
- B. product differentiation leads to low barriers to entry.
- C. economies of scale lead to a downward sloping market demand curve.
- D. high prices can lead to market failure.
Answer: D- Market failure occurs when there is under provision of a particular good i.e. there is no efficient allocation of goods and services. A monopoly always leads to the creation of deadweight loss to the economy.
Higher prices charged by the monopolist cause the deadweight loss to increase as more people are unwilling to buy the good which they would have if the economy was operating under perfect competition (where, P=MC). The monopolist produces where marginal revenue is equal to marginal cost (MR=MC). The price is determined by the demand curve at this quantity. Unlike perfect competition, the monopolist charges price such that MC. Thus, there is underproduction in the economy by the monopolist (as price charged by the monopolist is higher than what is charged in perfect competition) leading to market failure.
AQA AS Economics Questions With Answers
- AQA AS Economics Unit 1 Section A
- AQA AS Economics Unit 1 Section B Part 1
- AQA AS Economics Unit 1 Section B Part 2
- AQA AS Economics Unit 2 Section A
- AQA AS Economics Unit 2 Section B part 1
- AQA AS Economics Unit 2 Section B part 2
- AQA AS Economics 2015 Unit 1 Section A
- AQA AS Economics 2015 Unit 1 Section B Part 1
- AQA AS Economics 2015 Unit 1 Section B Part 2
- AQA AS Economics 2015 GCSE solved Question Paper


