SFP Project
This is a sample SFP Project submission. Please note that the emphasis of this particular project brief is different to yours and has been provided to you simply as an example that may help with the preparation of your own submission.
It is not a submission which scored 100% and it is not perfect but it does cover a number of the aspects relevant to the specific assignment brief it related to. Be aware that there are numerous ways in which to approach your project brief so this is NOT meant to be used a checklist of things to include. Nor is it to be used as a ‘model’ answer.
The usage of this sample is strictly prohibited and remains the intellectual property of the author - the author has given their permission for it to be used as a sample piece of work. Any copying of this work will be considered an act of plagiarism. The company used in this particular project brief is a fictious one.
Rubbersole Business Plan Report
1. Executive Summary
To succeed and survive, Rubbersole must develop new footwear markets and offer new footwear products responding to changes in consumer demand and behaviour. Rubbersole cannot compete on price and nor can it differentiate itself selling its current branded products. Latest projections show the business making increasing and unsustainable losses to 2021.
A ‘perfect storm’ of increased costs, rising inflation, and low wage growth threatens consumer confidence (Deloitte, 2017). The shift to online sales has empowered customers with information, choice and increasing expectations. (Retail Economics 2017). Clothing and footwear retailers are exposed to additional variables: fashion, seasonality and even the weather.
However, market analysis demonstrates that there are opportunities in an increasingly polarised market. Rubbersole should adopt a strategic position to meet the needs of a wider demographic of more affluent consumers, particularly men, who are more focused on quality, style and comfort and who are less price-sensitive.
2. Market Analysis
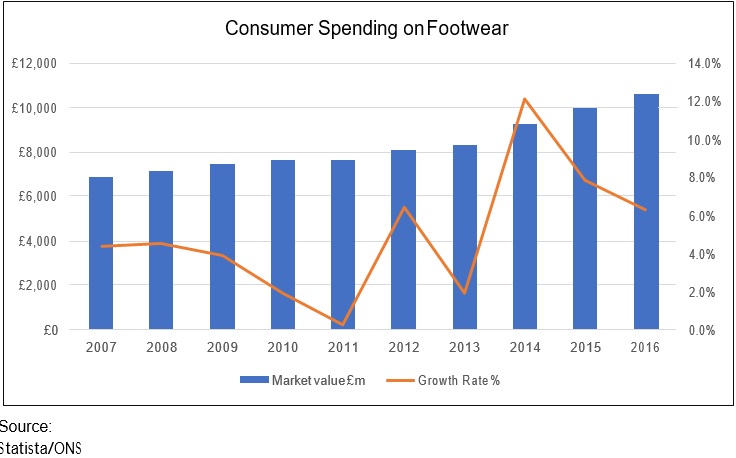
The UK had a retail footwear market worth £10.6bn in 2016 (Statista, 2017), part of a global footwear consumer market estimated to be over $200bn annually (Euromonitor, 2016). The UK market has been growing against a backdrop of low inflation with 39.3% growth in the
last five years and 6.2% in 2015-2016, pre-referendum. Since the referendum, the rate of retail sales growth has slowed and begun to decline as sterling weakness has driven higher inflation (FT, 2017). Online sales for clothing and footwear account 14.1% of the market and continue to grow strongly: 11.7% year on year to April 2017 (ONS, 2017).
Although women’s footwear is the largest part of the market, growth in male footwear sales has been stronger than female in recent years. In the US, the value of male footwear sales is fast catching up with female (Woolhouse, 2017). Men are adopting a wider choice of footwear driven by changing work patterns, images of ‘success’, culture and social media.
Retail Gazette finds the same trend for UK males with the male/female spending gap narrowing. ONS data puts the ratio of female/male/children’s footwear sales at 49%/28%/23% for the UK. There seems little doubt that male footwear is the fastest growing segment.
3. Industry Analysis
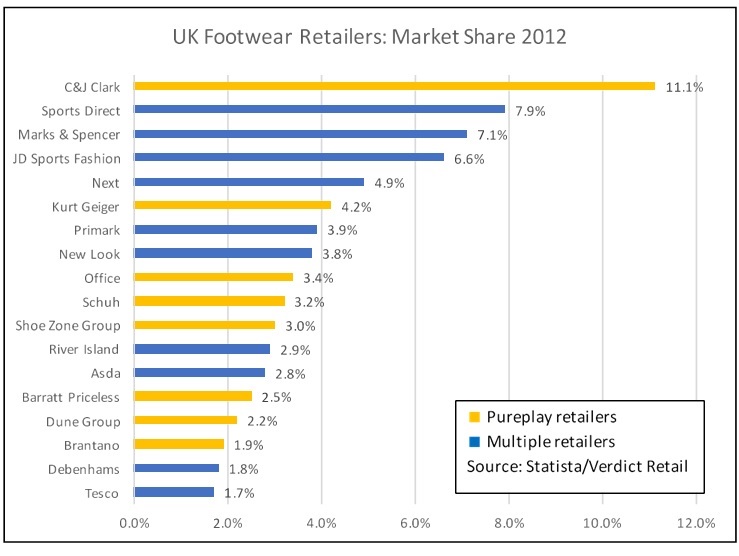
Market share of the UK’s largest footwear retailers is as follows:
A segmental analysis can be drawn from this secondary data combined with primary market research from visits to UK footwear retailers (Appendix) and online:
- Retail market players can be categorised between specialist or ‘pureplay’ clothing or footwear retailers and multiple or online retailers selling a wide range of
- Supermarkets, discount pureplay retailers such as Primark and multiples such as M&S and Next are capturing price-sensitive less brand-sensitive value-oriented consumers.
- Own brand stores are a notable segment. Clarks “the world&apso;s number one in everyday footwear” as a manufacturer and a retailer has existed since
Manufacturers are growing vertically, controlling marketing, retail experience, and margins. Church’s, Eco, Geox, Hunter and Ugg are adopting this model focusing on higher-spending brand-conscious affluent urban consumers.
- Dune, Kurt Geiger, Office, and Schuh are instore and online retailers selling branded
and own-branded footwear. Schuh aims to offer “aspirational but accessible fashion footwear”. Dune and Office are less focused on price and more focused on fashion, brand, quality and innovation.
- Independent shoe retailers range from single stores to multiple outlet
Charles Clinkard is typical - owner-managed with 33 UK stores and online selling
branded footwear with a family, quality and fit orientation.
- Luxury brand retailers such a Selfridges, Harvey Nichols and Net-A-Porter/Mr Porter (online) with a premium/luxury footwear product
Together the large retailers graphed had a 74.9% market share with multiples the largest segment at 43.4% leaving around 25% of the market for independent and other retailers.
The number of UK footwear stores is in long-term decline, down 20% from 2008 to 2014 (ONS). Brantano, Jones Bootmaker, are Barratts Priceless are examples of recent insolvencies.
Further secondary research was conducted by analysing the financial statements of a sample of leading footwear retailers:
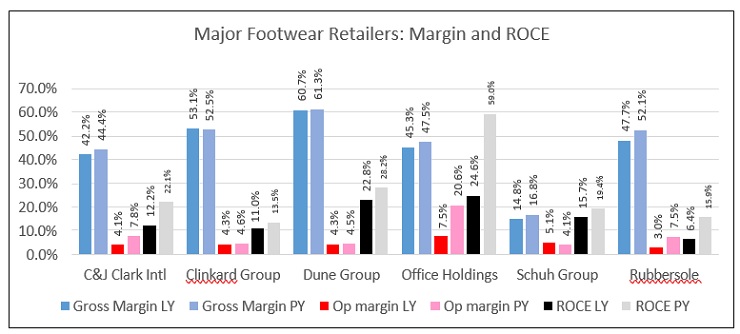
With total annual sales of £160m, Rubbersole has a market share of around 1.5% with a falling trend. The graph indicates that Rubbersole is generally underperforming compared with its similarly-sized competitors regarding margins and ROCE.
4. Opportunities and Threats
From the primary and secondary market analysis and macro review, the table below summarises the PESTEL factors applicable to Rubbersole to inform its choice of strategic options.
|
Political Volatility makes planning uncertain Forces behind globalisation are shifting Brexit: negatively impacting supply chain and margins Brexit: Uncertainty of residency and employment status for EU nationals in the UK affecting customers and staff Post-election UK uncertainty. |
Technological Online search is driving all retail sales, both online and instore Automation technologies, analytics and big data can drive competitive advantage Increasing mobile device usage among consumers Dependency on IT systems, the risk of failure and cybersecurity threat. |
|
Economic Consumer confidence is falling with rising inflation and pressure on incomes Brexit uncertainty for trade, imports and tariffs. Business rates increases, particularly in the South-East Depreciation of sterling Forex hedging to expire in supply chain. |
Environmental Sustainability an increasing concern for customers and stakeholders Potentially less use of leather and tanning, and more environmentally-friendly shoes and packaging. Having an ethical supply chain, particularly supplier employee welfare is essential for long-term value creation. Risk of underage workers in the supply chain. |
|
Social Changes in lifestyle and buying trends – shoes as a status symbol Men buying more footwear Cultural diversity trend Urban migration, more people living in towns and cities Social media and fashion influencers increasingly driving demand Changes in retail shopping habits, rise of the malls, airports and stations Ageing population |
Legal Changes in regulated pay likely to increase staff costs eg National Living Wage Statutory levies eg apprenticeship levy increasing the cost burden Digital regulation increasing complexity and cost Equal pay, pensions, and parental care legislation tending to increase compliance burden. |
Key: Opportunity | Threat | Both
Rubbersole sells a pair of shoes on average for £37. Data from Numbeo would suggest an average men’s price of around £60 and this was broadly substantiated by the retailer visits. This positions Rubbersole towards the value-led category where it cannot compete against far larger rivals.
Retail research is indicating a polarisation of the clothing and footwear markets.
- A “squeezed middle” has emerged – a large demographic of middle-income earners facing a fall in real income and cost of living rising, a trend driven by the forces of globalisation, skills gaps, and technological change. Sales to this segment are dominated by the large multiples online and offline focused on cost-leadership.
- For more affluent consumers, PwC believes that the UK “premium lifestyle” segment of the footwear and clothing market can grow by 6.6% CAGR to 2020, above a forecast range of 2-4.4% for the market overall. It identifies a shift towards more casual clothing in the workplace and socially. The growth of social media, celebrity endorsement, and the desire to identify, and share experiences is driving sales in this segment. This creates an opportunity Rubbersole should
In the children’s market, population and birth rate growth, the trend towards parenting
later in life, and an ageing demographic of grandparents with higher disposable incomes are
all driving growth at the premium end. The children’s footwear market is driven by growth (literally). Children are harder to fit, increasingly fashion conscious and sales online have a 50% returns rate compared to 35% for women’s footwear (KPMG, 2017). However, of the
three market segments, PwC see this as the market with the least potential for growth:
|
UK Clothing, Footwear and Accessories Market CAGR | |||
|
Forecast | |||
|
2009-15 |
2015-20 | ||
|
Footwear |
2.6% |
3.4% | |
|
Childrenswear |
2.1% |
2.6% | |
|
Menswear |
3.1% |
5.3% | |
|
Womenswear |
3.6% |
5.0% | |
|
Source: PwC | |||
Footwear comfort matters more than style to over 75% of males and 85% of females (Levin, 2015) and independent shoe retailers are the go-to source for expertise and footwear that fits. Rubbersole should exploit this opportunity.
In-store experience can help drive brand identity and loyalty online. Around 20% of the
£50bn clothing, footwear and accessory sales market in 2015 was online, up from 9.3% in 2010 (PwC, 2017). The online channel is expected to continue to take market share from the in-store channel accounting for 28% of sales by 2020. All this research is though pre- referendum. KPMG reports that:
- A key factor driving online sales of clothing and footwear is returns, and multiple online purchases with the intention of returning something is
- 62% of customers cite easy returns and free returns as a major driver of online
- BORIS returns (bought online returned in store) and click and collect can effectively integrate the online and instore channels and increase instore
The UK and Europe has a long heritage in high-quality men’s footwear and the weakness of sterling makes these home-produced products more attractive. A further trend Rubbersole can exploit is ‘athleisure’ wear - how sports footwear has morphed into leisure and office wear. ‘Premium sneakers’ worn with a business suit is a very different segment to value- oriented sports footwear and represents an opportunity for Rubbersole.
Data from Statista (2014) showed that the 30-49 age group spend the most on footwear, 9% more than the under 30s, an average of £6.30 per week compared £5.80. UK Census data shows that 28% of the population are the 30-49 age group, a market currently not served by Rubbersole. This represents a significant opportunity to broaden the customer base and products to meet the needs of this segment, focused particularly on the premium lifestyle and aspirational drivers identified.
|
Age |
Population |
% |
% | |
|
0–4 |
3,914,000 |
6.2 | ||
|
5–9 |
3,517,000 |
5.6 | ||
|
10–14 |
3,670,000 |
5.8 | ||
|
15–19 |
3,997,000 |
6.3 | ||
|
20–24 |
4,297,000 |
6.8 | ||
|
25–29 |
4,307,000 |
6.8 |
37.5 |
Current Rubbersole demographic |
|
30–34 |
4,126,000 |
6.5 | ||
|
35–39 |
4,194,000 |
6.6 | ||
|
40–44 |
4,626,000 |
7.3 |
|
50–54 |
4,095,000 |
6.5 | ||
|
55–59 |
3,614,000 |
5.7 | ||
|
60–64 |
3,807,000 |
6 | ||
|
65–69 |
3,017,000 |
4.8 | ||
|
70–74 |
2,463,000 |
3.9 | ||
|
75–79 |
2,006,000 |
3.2 | ||
|
80–84 |
1,496,000 |
2.4 | ||
|
85–89 |
918,000 |
1.5 | ||
|
90+ |
476,000 |
0.8 | ||
|
Total |
63,183,000 |
100 |
65 |
Combined demographic |
5. Strategies: Identification and Justification
Porter (1985) provides a framework for evaluating the strategic options available to Rubbersole by analysing competitive forces and generic strategic approaches to gain competitive advantage based on the preceding market analysis:
Cost Leadership: exploiting sources of cost advantage through its products and supply chain to compete industrywide on price. This is the strategy of footwear retailers such as the supermarkets and Primark.
Differentiation: unique product range industrywide in a way which has value for customers and potentially allows a premium price. Selfridges is an example of a footwear retailer differentiated on style, aspiration and luxury for more affluent customers.
Focus: meeting the needs of a market segment with two variants: cost focus and differentiation focus. The footwear retailer Herring has a differentiation focus on largely English branded premium quality men’s shoes sold mostly online.
Porter argues that the firm must adopt one of these strategies or face being stuck in a strategic no man’s land. Applying the ideas of Porter to Rubbersole:
|
Competitive Force |
Generic strategy which could be adopted by Rubbersole | ||
|
Cost Leadership |
Differentiation |
Focus | |
|
Buyer Power |
Footwear customers can easily switch between large national retailers offering the same brands or alternatives at the lowest price. Rubbersole is unable to |
Rubbersole is mostly selling branded footwear which is not unique to the market. |
Core competencies around range, quality, fit and customer service can enable Rubbersole to reduce customer price-sensitivity |
|
compete. | |||
|
Supplier Power |
Rubbersoles’ relatively low market share at 1.5% diminishes leverage with suppliers on terms. |
Rubbersole is not likely to be able to offer a unique product or control a market segment industry-wide to increase its bargaining power with suppliers. |
Developing Rubbersole’s own- brand footwear range could reduce dependency on manufacturers’ brands and provide competitive advantage. |
|
Competitive Rivalry |
Competition is intense among low-cost retailers. |
Luxury footwear retailers achieve differentiation with unique and desirable products but with high capital and marketing costs. |
Focus on customer service, customer experience and a more distinctive product mix can give some differentiation focus. |
|
Entry Barriers |
Ability to offer low prices is restricted to |
Selling branded shoes makes differentiation |
Core competencies offer some protection from new |
|
other higher volume retailers |
difficult for Rubbersole. |
entrants but the threat remains, particularly online. | |
|
Threat of |
Footwear cannot be substituted for another |
Rubbersole must | |
|
Substitutes |
product but rivalry is high. A threat exists in |
ensure its online | |
|
substitution of in-store for online sales by |
product offer is | ||
|
competitors and new entrants. |
differentiated and | ||
|
online customer | |||
|
experience is better | |||
|
than competitors. | |||
Hunt and Morgan (2001) advocate that comparative advantage and market orientation will enable a business to compete where it chooses its target market more astutely than its competitors and its products and services are better suited to customers’ preferences. In line with this and based on the opportunities identified in the market analysis, a mission statement for Rubbersole on which to base its strategy is conceived:
To provide the best footwear products and buying experience to attract, engage and delight our customers through our stores and online, always focused on quality, style and fit.
Combining Porter’ notion of focus for Rubbersole and based on the work of Ansoff (1957) and the market analysis, four alternatives strategies are considered in line with this mission:
|
Rubbersole Strategic Options | ||
|
Existing Products |
New Products | |
|
Existing Markets |
1. Market penetration |
3. Product development |
|
New Markets |
2. Market development |
3. Related diversification |
Option 1: Market penetration
This strategy focuses on existing markets and existing products:
- New stores would be opened each year where opportunity exists for example in new shopping malls or airports acknowledging the changing patterns in buying
- It is assumed there are some underperforming stores and a small number of stores would be closed each year when for example leases
- Online sales growth would be achieved by investing in the website for the UK market to improve online customer experience, information on choice, style, fit and an efficient returns process. Click and collect will also be
- Improve customer service with improved training and staff incentive
- Measure and target improvement in customer satisfaction (see NPS)
Option 2: Market development
A new market for existing products potentially exists in Europe. This could be achieved with stores in European locations and/or online sales in Europe with a multi-language mobile enabled website and pricing selling existing products.
However, this would require significant research on the European footwear market of which it is assumed the current management have limited knowledge. The uncertainty around Brexit and the economic risk factors identified in the PESTEL analysis make trading in Europe unattractive at this time and this option is rejected.
Option 3: Product development
This strategy would be focused on new products for existing markets:
- New product would be sourced from manufacturers focused on the premium lifestyle segment identified in the market analysis at higher selling prices and improved
- A premium athleisure range of products would be launched for existing markets, focused on quality, choice, fit and
- Emphasis would be placed on sourcing UK and EU product with improved quality, exclusivity and sustainability and improved margins
- Rubbersole would introduce exclusive own brand footwear, sourced in the UK and Europe focused in line with its new mission on quality, style and
- The staff incentive scheme and customer satisfaction initiative would also be introduced described in Option
Option 4: Related diversification
This would focus on developing new footwear products for new footwear markets leveraging the current retail infrastructure and management competencies.
- The market penetration and product development initiatives from Options 1 and 3 would both be
- In addition, Rubbersole would extend its market demographic into the 30-49 age group across all product ranges for men and women as identified as an opportunity in the market
With each of these strategies goes a measurable commitment to customer and employee satisfaction addressed with other KPIs below.
The following operational factors have been considered in defining these strategic options:
- Staff: retail is the largest low pay sector in the UK (Clarke & D’arcy, 2016) and Rubbersole is only paying the national minimum wage. Pay is its largest
Staff motivation is critical to a successful change of strategy. For this reason, a staff sales incentive scheme is proposed linked to growth to enable staff to share in the success of the strategy.
- Staff training: all the strategic options require change and increased commitment from staff, hence training will be
- Customer satisfaction: A major initiative underlying all strategic options will be increasing customer satisfaction, examined under KPIs
- Supply chain: An assumption is made that suitable quality products to drive the product-oriented growth strategies can be sourced. Italy, Spain, and Portugal produce 2/3 of all EU-manufactured footwear, with Italy alone producing 50% of production (EC, 2012). These sources will be key to Rubbersole to improve quality, style, exclusivity and value, particularly the launch of own-brand
- Coffee shops: the coffee shops do appear to be increasing footfall and possibly customer dwell time. However retailing coffee is not the core business. The
expansion of the men’s range and the pressure on floor space may make the coffee shops obsolete or even a hindrance to growth in the long term.
Other major strategic choices for Rubbersole considered but rejected where:
- Expansion into clothing: this is unrelated diversification and significantly riskier. It is outside the knowledge of the management and extension of the brand name and retail network resources and requires a new supply
- Acquisition/consolidation: this may be viable but needs more market data and analysis.
The potential financial outcome from each of the three strategies identified (1,3 and 4) is modelled below.
6. Shareholder Value and KPI selection
Rumelt (2011) believes that strategy involves identifying critical factors and directing management actions to deal with these factors. Based on the external market analysis and PESTEL analysis, three critical success factors can be identified for Rubbersole:
- Financial sustainability and profitability
- An attractive product and retail offer
- Satisfied stakeholders
Smith (2015) describes shareholder value as the creation of additional wealth for the ultimate business owners and whether management is acting appropriately to create this wealth. Smith believes this requires a rate of return higher than the cost of the capital utilised to generate that return, with the rate of return given by:
Operating cash flow
Shareholder’s equity and net debt
However, by itself this return on capital (ROCE) is not necessarily an effective indicator of long-term value creation. Measuring the cost of capital involves theoretical assumptions on
the risk-free rate, market rates of return and risk sensitivity. Agency theory suggests that conflicts of interest can arise in the narrow management of ROCE and it can be manipulated by management. Lazonick and O’Sullivan (2000) suggest that an aggressive short term pursuit of narrow shareholder value may run down a company for example attempting to reduce workforce or pay, increase dividends, or creating unjustified incentives for senior management.
Rappaport (1998) describes ‘enlighted self-interest’ as a more comprehensive alternative where long-term shareholder value is created by sound commercial and financial management but also engaging with shareholders and stakeholders. Mauboussin and Rappaport (2016) suggest that shareholder value can be &apso;reclaimed&apso; from manipulation and Friedman’s (1970) now unpopular view of profit maximisation by:
- Clear strategic objectives at board level and acceptable compromises where objectives may come into conflict with an aggressive definition of shareholder
- Encouraging behaviours consistent with achieving non-financial and financial performance
- Communication with all stakeholders: planning, decision-making, and policies that support strategy and long-term
For Rubbersole, a more comprehensive measure of shareholder value creation necessitates a range of financial and non-financial KPIs which recognizes that stakeholder engagement is
the route to create long-term value for Rubbersole and its owners. Dividend level will not be a KPI for Rubbersole. In a period when the business is investing, the dividend may need to be temporarily foregone in the interests of long-term shareholder and brand value.
The following 10 KPIs are proposed for Rubbersole with indicative targets as a broader indicator of shareholder value:
|
Critical Success Factor |
KPI |
Target |
|
Financial sustainability and profitability |
Sales total and by category |
20% growth within 5 Years |
|
Gross margin |
5% growth within 5 Years | |
|
ROCE |
5%, in line with competitors | |
|
Attractive product and retail offer |
Sales per sq foot |
5% annual improvement |
|
Inventory Turn |
<6 weeks | |
|
Average customer transaction spend |
5% annual improvement | |
|
Footfall and conversion – in-store and online equivalent |
5% annual improvement | |
|
Sales to retail staff costs |
5% annual improvement |
|
Satisfied stakeholders |
Customer satisfaction/Net Promoter Score |
50+ |
|
Employee engagement |
2% annual improvement |
A concise number of KPIs spanning the critical success factors is also consistent with the work of Kaplan and Norton (2004).
The reasoning behind each KPI is as follows:
- Sales total and by category: measures retail revenue performance across any period, per store, region, product group or in
- Gross margin: given by (revenue-costs of sales)/revenue, provides a measure of product profitability and retail
- ROCE: an indicator, though not the only indicator of shareholder value creation and the effectiveness of capital utilisation, useful for benchmarking with
- Sales per sq foot: average revenue for every square foot of sales space, indicates the efficiency of the retail operation and product
- Inventory Turn (cost of sales/inventory): indicates sales efficiency, a low turn may indicate obsolete stock which is failing to
- Average customer transaction spend: this can be measured in a single transaction or tracked across a year for customers as a measure of loyalty and repeat business. A loyalty card and promotions can augment this
- Footfall and conversion: the number of people entering a store or accessing the website and the number who subsequently make a purchase. A measure of the attractiveness of the product and the effectiveness of the sales conversion
- Sales to retail staff costs: measures the sales performance of retail staff collectively or individually.
- Customer satisfaction/Net Promoter Score: measuring customer satisfaction instore or online by quantifying promoters, detractors and passives (Reichheld, 2003). An NPS of 50+ should be an aim and can be benchmarked. Data for this KPI can be gathered instore using a Smiley Terminal or
- Employee engagement: can be measured through an annual survey possibly combined with staff turnover and absenteeism rates.
Many of these KPIs can be looked at on a consolidated company level and sub-levels for products and individual stores.
There will be a larger number of operational performance indicators. For example, online sales performance indicators might be abandoned carts, retuning customers, social media engagement, pay-per-click traffic volume v organic search and returns rate.
7. Financial analysis and projections
Analysis of Rubbersole’s currently projected financial performance indicates escalating losses and negative ROCE. The liquidity and cash position is weakening and there is a risk that a breach of bank covenants linked to financial performance and position could lead to withdrawal of bank support and insolvency. Status quo is clearly not an option.
Rubbersole Shoes: Liquidity Analysis
|
2015 2016 2017 2018 2019 2020 2021 | ||||||||
|
Current Assets - Current |
Liabilites |
10,183 |
10,495 |
10,920 |
10,264 |
8,204 |
4,739 |
-242 |
|
Current ratio |
1.52 |
1.52 |
1.53 |
1.50 |
1.38 |
1.20 |
0.99 | |
|
Quick ratio |
0.06 |
0.06 |
0.06 |
0.06 |
0.06 |
0.05 |
0.04 | |
|
Net Cash Flow £&apso;000 |
5,531 |
-5,324 |
-1,866 |
-132 |
-894 |
-2,124 |
-3,488 | |
|
Closing Cash £&apso;000 |
-4,419 |
-9,743 |
-11,610 |
-11,742 |
-12,635 |
-14,760 |
-18,248 | |
Rubbersole Shoes: 2016 Product Sales and margin analysis
|
Product line |
Margin |
SKUs |
SKU |
Weight |
Shelf space |
Sales £&apso;000 |
Sales |
Weight |
Avg |
Item £ |
|
Web site |
53% |
401 |
9.4% |
15,663 |
9.9% |
39.09 | ||||
|
Female adult range |
55% |
2,093 |
49.2% |
55.0% |
90,927 |
57.7% |
43.44 | |||
|
Male adult range |
48% |
515 |
12.1% |
17.0% |
18,898 |
12.0% |
36.68 | |||
|
Children and Young Teenage |
60% |
998 |
23.4% |
22.0% |
31,045 |
19.7% |
31.12 | |||
|
Accessories |
46% |
250 |
5.9% |
6.0% |
1,101 |
0.7% |
4.40 | |||
|
Total |
4,257 |
100.0% |
100.0% |
157,634 |
100.0% |
37.03 | ||||
Conclusions can be drawn from this data:
- Rubbersole’s average price point positions it dangerously in the cost leaders’ market but without the volume and buying power to sustain low
- The accessories segment is significantly underperforming comparing sales (0.7%) with shelf-space (6.0%).
- Male footwear sales are significantly below potential based on the market
Based on the strategic options identified earlier, the following options have been modelled with assumptions shown:
Option 1: Market Penetration Strategy
Assumptions:
- A net reduction by 1 store each year: 2 under-performing stores closing and one new store opening where opportunity
- 1% increase in pricing v benchmarks each year.
- 5% increase in staff costs to fund a sales incentive scheme and a 1% increase in staff training linked to sales and margin improvement.
- 5 additional coffee shops per
- Reduced space allocated to accessories with the space used proportionately for footwear segments. The ratio of female/male/childrens/accessories becomes 57%/18%/23%/2%.
- Online sales increase by 4% with marketing budget increased by 1% and 1% added to overheads for website
Outcome:
Strategic Option: Market Penetration
|
Income Statement |
2016 |
2017 |
2018 |
2019 |
2020 |
2021 | ||
|
KPI |
Total Retail and Web Sales £&apso;000 |
159,874 |
189,896 |
197,554 |
205,464 |
213,670 |
222,218 | |
|
Direct Costs |
83,561 |
99,892 |
107,648 |
113,587 |
119,634 |
126,026 | ||
|
Gross Profit |
76,312 |
90,004 |
89,905 |
91,877 |
94,036 |
96,192 | ||
|
Retail outlet wages |
37,587 |
39,997 |
39,643 |
39,289 |
38,935 |
38,581 | ||
|
Marketing |
8,561 |
8,821 |
10,333 |
10,715 |
11,110 |
11,519 | ||
|
Overheads |
25,396 |
28,327 |
28,795 |
29,277 |
29,774 |
30,289 | ||
|
Operating Profit |
4,769 |
12,859 |
11,135 |
12,596 |
14,217 |
15,803 | ||
|
Interest and Tax |
1,554 |
3,735 |
2,903 |
3,041 |
3,182 |
3,301 |
5 Years | |
|
Profit after Tax |
3,215 |
9,124 |
8,232 |
9,555 |
11,036 |
12,501 |
50,448 | |
|
EBITDA |
15,389 |
23,754 |
21,972 |
23,374 |
24,936 |
26,461 | ||
|
KPI |
Gross Margin % |
48% |
47% |
46% |
45% |
44% |
43% | |
|
Net operating margin % |
3% |
7% |
6% |
6% |
7% |
7% | ||
|
KPI |
ROCE |
6% |
17% |
14% |
15% |
17% |
18% | |
|
Net Debt / Equity % |
54% |
36% |
25% |
8% |
-10% |
-26% | ||
|
Net Cash Balance |
-9,743 |
-640 |
5,146 |
15,204 |
26,142 |
37,778 | ||
|
5 Years | ||||||||
|
Base Case Operating Profit |
3,215 |
-735 |
-1,817 |
-2,874 |
-4,019 |
-5,267 |
-14,710 | |
|
Improvement/(Decline) |
0 |
9,859 |
10,049 |
12,429 |
15,054 |
17,768 |
65,159 | |
|
Sales Growth |
18.8% |
4.0% |
4.0% |
4.0% |
4.0% | |||
|
KPI |
Sales per square foot |
6,765 |
7,792 |
8,143 |
8,509 |
8,893 |
9,297 | |
|
KPI |
Inventory days |
180.3 |
159.6 |
131.7 |
104.4 |
78.2 |
53.2 | |
|
KPI |
Average transaction value £ |
37.03 |
38.85 |
38.94 |
39.02 |
39.11 |
39.19 | |
|
KPI |
Sales:retail staff costs ratio |
4.25 |
4.75 |
4.98 |
5.23 |
5.49 |
5.76 |
Option 3: Product development
Assumptions:
- New premium lifestyle, athleisure and men’s products enable a 5-10% increase in price v
- Staff incentive and training as per Option 1
- 1% increase in advertising
- Further increase in men’s segment share, female/male/childrens/accessories now 55%/20%/23%/2% in line with market
- Cost prices increase by 4% reflecting new product mix
Outcome:
Strategic Option: Product Development
|
Income Statement |
2016 |
2017 |
2018 |
2019 |
2020 |
2021 | ||
|
KPI |
Total Retail and Web Sales £&apso;000 |
159,874 |
202,851 |
214,835 |
219,307 |
223,023 |
228,247 | |
|
Direct Costs |
83,561 |
103,284 |
116,299 |
123,090 |
124,341 |
130,901 | ||
|
Gross Profit |
76,312 |
99,566 |
98,536 |
96,217 |
98,682 |
97,346 | ||
|
Retail outlet wages |
37,587 |
40,351 |
40,351 |
40,351 |
40,351 |
40,351 | ||
|
Marketing |
8,561 |
10,398 |
13,051 |
13,798 |
14,095 |
14,400 | ||
|
Overheads |
25,396 |
28,623 |
29,337 |
29,772 |
30,184 |
30,661 | ||
|
Operating Profit |
4,769 |
20,195 |
15,798 |
12,297 |
14,053 |
11,934 | ||
|
Interest and Tax |
1,554 |
5,085 |
3,633 |
2,824 |
3,079 |
2,553 |
5 Years | |
|
Profit after Tax |
3,215 |
15,109 |
12,165 |
9,473 |
10,974 |
9,381 |
57,102 | |
|
EBITDA |
15,389 |
30,782 |
26,385 |
22,884 |
24,640 |
22,521 | ||
|
KPI |
Gross Margin % |
48% |
49% |
46% |
44% |
44% |
43% | |
|
Net operating margin % |
3% |
10% |
7% |
6% |
6% |
5% | ||
|
KPI |
ROCE |
6% |
26% |
19% |
15% |
16% |
13% | |
|
Net Debt / Equity % |
54% |
18% |
6% |
-3% |
-11% |
-20% | ||
|
Net Cash Balance |
-9,743 |
9,450 |
16,434 |
21,943 |
27,413 |
33,544 | ||
|
5 Years | ||||||||
|
Base Case Operating Profit |
3,215 |
-735 |
-1,817 |
-2,874 |
-4,019 |
-5,267 |
-14,710 | |
|
Improvement/(Decline) |
0 |
15,844 |
13,981 |
12,347 |
14,993 |
14,648 |
71,813 | |
|
Sales Growth |
26.9% |
5.9% |
2.1% |
1.7% |
2.3% | |||
|
KPI |
Sales per square foot |
6,765 |
7,974 |
8,444 |
8,594 |
8,283 |
8,455 | |
|
KPI |
Inventory days |
180.3 |
137.9 |
98.3 |
77.1 |
77.8 |
57.1 | |
|
KPI |
Average transaction value £ |
37.03 |
40.45 |
40.56 |
40.64 |
42.63 |
42.71 | |
|
KPI |
Sales:retail staff costs ratio |
4.25 |
5.03 |
5.32 |
5.44 |
5.53 |
5.66 |
Option 4: Related Diversification
Assumptions
- Store changes as per Option 1
- New premium lifestyle, athleisure and men’s products together with market development initiatives enable a 10-25%% increase in price v
- Female/male/childrens/accessories now 48%/27%/23%/2% close to the ONS overall market
- Advertising increased by 2%
- Staff incentive and training as per Option 1
- Cost prices increase by 6%
- 2 additional coffee shops per year
- Sterling weakens to USD 1.25 (or Euro equivalently)
- Interest rate increases to 4% pa Outcome:
|
Strategic Option: Related Diver |
sification | |||||||
|
Income Statement |
2016 |
2017 |
2018 |
2019 |
2020 |
2021 | ||
|
KPI |
Total Retail and Web Sales £&apso;000 |
159,874 |
206,550 |
214,830 |
217,945 |
218,921 |
224,173 | |
|
Direct Costs |
83,561 |
105,386 |
110,604 |
117,502 |
119,537 |
127,384 | ||
|
Gross Profit |
76,312 |
101,164 |
104,225 |
100,443 |
99,383 |
96,789 | ||
|
Retail outlet wages |
37,587 |
39,997 |
39,643 |
39,289 |
38,935 |
38,581 | ||
|
Marketing |
8,561 |
12,131 |
15,534 |
16,259 |
16,510 |
16,675 | ||
|
Overheads |
25,396 |
28,972 |
29,476 |
29,788 |
30,025 |
30,429 | ||
|
Operating Profit |
4,769 |
20,065 |
19,572 |
15,107 |
13,914 |
11,105 | ||
|
Interest and Tax |
1,554 |
5,030 |
4,464 |
3,521 |
3,197 |
2,530 |
5 Years | |
|
Profit after Tax |
3,215 |
15,035 |
15,109 |
11,586 |
10,717 |
8,574 |
61,021 | |
|
EBITDA |
15,389 |
30,959 |
30,409 |
25,885 |
24,633 |
21,763 | ||
|
KPI |
Gross Margin % |
48% |
49% |
49% |
46% |
45% |
43% | |
|
Net operating margin % |
3% |
10% |
9% |
7% |
6% |
5% | ||
|
KPI |
ROCE |
6% |
26% |
24% |
18% |
16% |
12% | |
|
Net Debt / Equity % |
54% |
13% |
12% |
4% |
-2% |
-11% | ||
|
Net Cash Balance |
-9,743 |
12,383 |
12,708 |
17,329 |
21,289 |
27,769 | ||
|
5 Years | ||||||||
|
Base Case Operating Profit |
3,215 |
-735 |
-1,817 |
-2,874 |
-4,019 |
-5,267 |
-14,710 | |
|
Improvement/(Decline) |
0 |
15,769 |
16,925 |
14,460 |
14,736 |
13,841 |
75,731 | |
|
Sales Growth |
29.2% |
4.0% |
1.5% |
0.4% |
2.4% | |||
|
KPI |
Sales per square foot |
6,765 |
7,772 |
7,410 |
7,540 |
7,262 |
7,467 | |
|
KPI |
Inventory days |
180.3 |
120.1 |
144.5 |
115.4 |
112.6 |
85.1 | |
|
KPI |
Average transaction value £ |
37.03 |
42.45 |
46.29 |
46.39 |
48.35 |
48.45 | |
|
KPI |
Sales:retail staff costs ratio |
4.25 |
5.16 |
5.42 |
5.55 |
5.62 |
5.81 |
It is concluded that the related diversification strategy is the recommended option for Rubbersole giving the best financial KPI performance over the other options for profit and ROCE and cash. However non-financial KPIs would also have to be modelled and taken into account before reaching a final decision.
7. Strategic Risks
In addition to the generic PESTEL risks identified, the selected strategy of related diversification presents specific risks:
- Management may be unable to successfully manage change or take forward a bold and risky strategy of market and product
- The business may not be able to find sources of supply for the right new products at the right price in the UK and
- Rubbersole may have to rely on the design knowledge of suppliers to develop new products who lack insight into the UK
- Rubbersole’s product buyers may could make poor judgements on product development.
- Attempting to increase the average transaction value carries the risk that products will not be attractive to existing customers and it proves difficult to attract new customers.
- Store locations and local demographics may not be favourable for the strategy to work.
- Increasing marketing spend and getting the optimal marketing mix (product, price, promotion, place) may prove
- Staff may not buy-in to the change in selling to a wider age group of customers and new processes to operate even with the incentive
- Web site development costs may not be controlled and there are delays, cost overruns or technical
- Environmental, sustainability and worker rights policies could be compromised in the pressure to compete and find new
- Reporting mechanisms may not be able to measure the select KPIs and more general performance indicators accurately and
- Competitors could react tactically or strategically to actively prevent Rubbersole’s strategy working for example with aggressive
- The loss of a key supplier could constrain Rubbersole’s ability to sell products and compete.
- Rubbersole may be dependent on key staff or management whose services it may be unable to retain with the
- Liquidity risk increases as the business
8. Recommendations and conclusion
Rubbersole should follow a strategy of related diversification to reposition itself towards serving a more affluent urban consumer by focusing on:
- New premium lifestyle, high-quality products
- Increasing its emphasis on the growing demand for men’s
- Developing premium athleisure footwear
- Developing new stores in optimal locations
- Closing underperforming stores
- Ensuring it’s online product offer is attractive and efficient in areas such a fit/sizing and
- Promoting its expertise in footwear comfort and fit
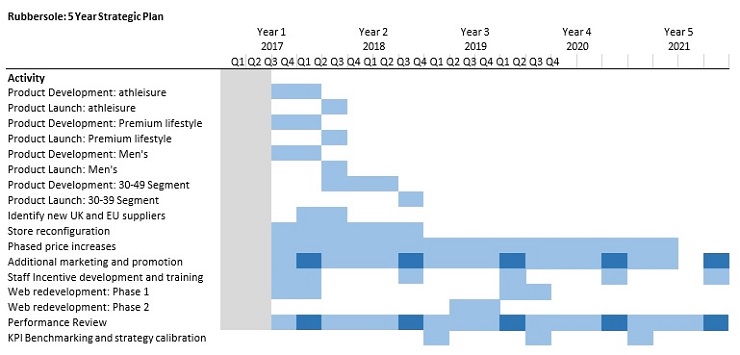
This must be combined with improving customer and staff satisfaction and optimising the financial and non-financial KPIs identified. A 5-year plan for the strategy is as follows:
Appendix: Retailer Visits
|
Retailer |
Store Location |
Date of Visit |
|
Asda |
Watford |
03-Jun-17 |
|
Church&apso;s |
Bicester |
27-May-17 |
|
Clarks |
Bicester |
27-May-17 |
|
Dune |
London, St Pancras |
31-May-17 |
|
M&S |
Watford |
03-Jun-17 |
|
Next |
Watford |
03-Jun-17 |
|
Office |
London, Bruswick Centre |
31-May-17 |
|
Primark |
Watford |
03-Jun-17 |
|
Schuh |
Watford |
03-Jun-17 |
|
Selfridges |
London, Oxford Street |
31-May-17 |
|
Shoe Zone |
Watford |
03-Jun-17 |
|
Sports Direct |
Borehamwood |
28-May-17 |
|
Tesco |
Watford |
03-Jun-17 |
|
Tod&apso;s |
Bicester |
27-May-17 |
|
Ugg |
Bicester |
27-May-17 |
|
Retailer |
Website |
Date of Visit |
|
Asda |
04-Jun-17 | |
|
Church&apso;s Clarks Dune Herring |
04-Jun-17 04-Jun-17 04-Jun-17 04-Jun-17 | |
|
M&S |
04-Jun-17 | |
|
Next |
04-Jun-17 | |
|
Office |
04-Jun-17 | |
|
Primark |
04-Jun-17 | |
|
Schuh Selfridges Shoe Zone |
05-Jun-17 05-Jun-17 05-Jun-17 | |
|
Sports Direct |
05-Jun-17 | |
|
Tesco |
05-Jun-17 |
References
Ansoff, I., 1957. Strategies for Diversification. Harvard Business Review, 35(5), pp.113–124.
Barrett, C., 2011. Retail choices: Shopping at the airport takes off - FT.com. FT. Available at: https://www.ft.com/content/f3946dd0-ffd4-11e0-89ce-00144feabdc0 [Accessed June 11, 2017].
APICCAPS Footwear Technology Centre, 2014. Footwear Consumer 2030 - Incorporating Global Trends to Foresight Footwear Market. 2017, p.48. Available at: https://issuu.com/joanavazteixeira/docs/footwear_consumer_2030 [Accessed June 6, 2017].
Armstrong, A., 2016. The rise of athleisure: how the high street is cashing in on office-to- gym wear. Telegraph. Available at: http://www.telegraph.co.uk/business/2016/09/17/the- rise-of-athleisure-how-the-high-street-is-cashing-in-on-offi/ [Accessed June 5, 2017].
Bearne, S., 2017. Analysis: Can Amazon dominate the fashion world? Retail Week. Available at: https:http://www.retail-week.com/sectors/fashion/analysis-can-amazon-dominate-the- fashion-world/7019298.article [Accessed May 17, 2017].
BFC, 2016. The British Fashion Industry and London Fashion Week Facts & Figures. BFC: British Fashion Council. Available at: http://www.londonfashionweek.co.uk/news_detail.aspx?ID=750 [Accessed May 30, 2017].
Butler, S., 2017. Shoe retailer Brantano goes into administration with 1,000 jobs at risk | Business | The Guardian. Guardian. Available at: https://www.theguardian.com/business/2017/mar/22/shoe-retailer-brantano-goes-into- administration-with-1000-jobs-at-risk [Accessed May 30, 2017].
Clarks, 2016. Clarks Corporate Responsibility | Clarks.com. Available at: http://www.clarks.com/corporate-responsibility/ [Accessed May 30, 2017].
Companies House, 2017. Companies House, Statutory Accounts for UK Companies. Available at: https://beta.companieshouse.gov.uk/company/SC125327/filing-history [Accessed May 26, 2017].
Craik, L., 2015. Children’s fashion: small people, big business | Fashion | The Guardian. Guardian. Available at: https://www.theguardian.com/fashion/2015/feb/15/childrenswear- childrens-fashion-prince-george-suri-cruise-harper-beckham [Accessed June 10, 2017]
Clarke, S. & D ’arcy, C., 2016. Low Pay Britain 2016. Available at: http://www.resolutionfoundation.org/app/uploads/2016/10/Low-Pay-Britain-2016.pdf [Accessed June 14, 2017].
Deloitte, 2016. Retail Showcase. Deloitte. Available at: https://www2.deloitte.com/uk/en/pages/consumer-business/articles/retail-showcase.html [Accessed May 30, 2017].
Deloitte, 2017. Retail Trends 2017. Available at: https://www2.deloitte.com/uk/en/pages/consumer-business/articles/retail-trends- 2017.html [Accessed May 13, 2017].
DLA Piper, 2017. Retail 2017 - a challenging road ahead? | Insights | DLA Piper Global Law Firm. Available at: https:http://www.dlapiper.com/en/uk/insights/publications/2017/01/retail- 2017-a-challenging-road-ahead/ [Accessed May 30, 2017].
Donaldson, L. & Davis, J.H., 1991. Stewardship Theory or Agency Theory: CEO Governance and Shareholder Returns. Australian Journal of Management, 16(1), pp.49–64. Available at: http://faculty.wwu.edu/dunnc3/rprnts.stewardshiporagency.pdf [Accessed June 2, 2017].
Dorf, R.C. & Raitanen, M., 1997. The Balanced Scorecard: Translating Strategy Into Action. Proceedings of the IEEE, 85(9), pp.1509–1510. Available at: http://ieeexplore.ieee.org/document/628729/ [Accessed June 9, 2017].
Elwin, P. & Hirst, R., 2007. Guide to key performance indicators. PriceWaterhouseCoopers, pp.1–28. Available at: https:http://www.pwc.com/gx/en/audit-services/corporate- reporting/assets/pdfs/uk_kpi_guide.pdf [Accessed May 15, 2017].
European Commission, The EU footwear industry - European Commission. 2012. Available at: https://ec.europa.eu/growth/sectors/fashion/footwear/eu-industry_en [Accessed June 14, 2017].
Euromonitor, 2016. COMFORT CONQUERS THE GLOBAL FOOTWEAR, Available at: http://www.euromonitor.com/comfort-conquers-the-global-footwear-market/report [Accessed June 4, 2017].
Fera, N., 1997. Using shareholder value to evaluate strategic choices. Management Accounting, 79(5), pp.47–51. Available at: https://search.proquest.com/docview/229729251?pq-origsite=gscholar [Accessed May 23, 2017].
Friedman, M. (1970) The Social Responsibly of Business is to Increase Profits, New York Times Magazine, p. PP 32–33.
FT, 2017 Sharp drop in UK retail sales blamed on higher prices Avialable at: www.ft.com/content/60f371b2-266e-11e7-a34a-538b4cb30025 [Accessed: 2017-06-14]
Giles, C., 2016. Britain’s “squeezed middle” face jam tomorrow. FT. Available at: https://www.ft.com/content/606ba310-ad81-11e6-ba7d-76378e4fef24 [Accessed May 13, 2017].
Giles, C. & Cornish, C., 2017. UK spending falls as consumers feel the pinch. Available at: https://www.ft.com/content/b9e1f2f4-49f4-11e7-a3f4-c742b9791d43 [Accessed June 6, 2017].
HappyOrNot, 2017. Our Service - Measure Happiness levels with HappyOrNot. Available at: https://www.happy-or-not.com/en/measure/ [Accessed June 3, 2017].
Hunt, S.D. & Morgan, R.M., 1995. The Comparative Advantage Theory of Competition. Journal of Marketing, 59(2), p.1. Available at: http://www.jstor.org/stable/1252069?origin=crossref [Accessed May 14, 2017].
IBISWorld, 2016. Footwear Retailers in the UK Market Research | IBISWorld. Available at: https://www.ibisworld.co.uk/market-research/footwear-retailers.html [Accessed June 10, 2017].
IBISWorld, 2016. E-Commerce VS Brick and Mortar: Shoe Industry. Available at: https://www.ibisworld.com/media/2016/09/29/e-commerce-vs-brick-mortar-shoe- industry/ [Accessed June 6, 2017].
Inman, P., 2017. UK clothing and shoe sales suffer biggest slump since 1991. Guardian. Available at: https:http://www.theguardian.com/business/2016/mar/24/uk-retail-spending- experiences-biggest-slump-since-1991 [Accessed May 10, 2017].
Inside Retail, 2015. The UK Fashion Market Opportunity, Available at: http://www.purelondon.com/files/pure_market_report_2016.pdf [Accessed May 30, 2017].
Insights, A.I., 2016. UK fashion industry statistics 2015 & retail stats | Fabacus Overture. Fabacus. Available at: https://fabacus.com/overture-scm-plm/uk-fashion- industry-stats/ [Accessed May 30, 2017].
Kaplan, R.S. & Norton, D.P., 2004. Supporting the Change Agenda That Supports Strategy Execution. Hqrvard School Publishing, 6(1).
KPMG, 2017. Retail Survey 2017 - What consumers are telling us. Available at: https://home.kpmg.com/uk/en/home/insights/2017/02/retail-survey-2017-what- consumers-are-telling-us.html [Accessed May 20, 2017].
Lazonick, W. & O’Sullivan, M., 2000. Maximizing shareholder value: a new ideology for corporate governance. Economy and Society, 29(1), pp.13–35.
Levin, C, 2015 Comfort Checkup: How Comfort Footwear is Faring at Retail – Vamp, Available at: vampfootwear.com/comfort-checkup-how-comfort-footwear-is-faring-at- retail/ [Accessed June 13, 2017].
Mauboussin, M.J. & Rappaport, A., 2015. Reclaiming the Idea of Shareholder Value. Journal of Applied Corporate Finance, 27(2), pp.28–33. Available at: http://doi.wiley.com/10.1111/jacf.12115 [Accessed June 13, 2017].
Mintel, 2015. Footwear Retailing - UK - Consumer market research report - company profiles
- market trends - 2015. Available at: http://store.mintel.com/footwear-retailing-uk-july- 2013 [Accessed May 31, 2017].
Mintzberg, H. & Waters, J.A., 1985. Strategies, Deliberate And Emergent. Strategic Management Journal, 6(3), pp.257–272. Available at: http://links.jstor.org/sici?sici=0143- 2095%28198507%2F09%296%3A3%3C257%3AOSDAE%3E2.0.CO%3B2-T [Accessed June 4,
2017].
Murphy, D. & Taylor, J., 2016. Analysis: 10 key performance indicators for the new retailing world | Analysis | Retail Week. Retail Week. Available at: https://www.retail- week.com/analysis/analysis-10-key-performance-indicators-for-the-new-retailing- world/7011249.article [Accessed May 31, 2017].
Numbeo, 2017. Cost of Living in United Kingdom, 2017 Available at: https://www.numbeo.com/cost-of-living/country_result.jsp?country=United+Kingdom [Accessed June 11, 2017].
ONS, 2011. Office for national statistics 2001 UK census (ons.gov.uk/ons/guide- method/census/2001). Available at: https:/https://www.ons.gov.uk/census/2011census/2011ukcensuses [Accessed June 4, 2017].
ONS, 2017. Retail sales in Great Britain - Office for National Statistics. Available at: https:/https://www.ons.gov.uk/businessindustryandtrade/retailindustry/bulletins/retailsales/apr2 017#whats-the-story-in-online-sales [Accessed May 26, 2017].
Parmenter, D., 2007. Key Performance Indicators (KPI): Developing, Implementing, and Using Winning KPIs, Available at: http://scholar.google.com/scholar?hl=en&btnG=Search&q=intitle:No+Title#0%5Cnhttp:http://bo oks.google.com/books?hl=fr&lr=&id=sLP_ipWrfssC&pgis=1 [Accessed May 15, 2017].
Porter, M.E., 1996. What Is Strategy? Harvard business review, 74(6).
Porter, M.E., 1985. Competitive advantage, Available at: https://books.google.co.uk/books/about/Competitive_Advantage.html?id=PpZxQgAACAAJ& redir_esc=y [Accessed May 14, 2017].
Pure London/BRC/Mintel, 2015. The UK Fashion Market Opportunity, Available at: http://www.purelondon.com/files/pure_market_report_2016.pdf [Accessed June 10, 2017].
PwC, 2017. 2017 Total Retail survey. Available at: https://www.pwc.com/gx/en/industries/retail-consumer/total-retail.html [Accessed May 12, 2017].
PwC, 2007. Guide to key performance indicators. PriceWaterhouseCoopers, pp.1–28. Available at: http://www.pwc.com/gx/en/corporate- reporting/assets/pdfs/UK_KPI_guide.pdf.
Rappaport, A., 1986. Creating shareholder value: a guide for managers and investors, Free Press. Available at: https://books.google.co.uk/books?hl=en&lr=&id=bc0PjplGR5gC&oi=fnd&pg=PP1&dq=share holder+value+creation&ots=R7Tq_UKTD0&sig=QxrVaEOM8MPOKQfttO0jS3e4e8g#v=onepa ge&q=roce&f=false [Accessed June 2, 2017].
Reichheld, F., 2003. The one number you need to grow. Harvard Business Review, (December), pp.1–11. Available at: https://hbr.org/2003/12/the-one-number-you-need-to- grow.
Rumelt, R., 2011. Good Strategy/Bad Strategy: The Difference and Why It Matters., Available at: http://www.amazon.co.uk/Good-Strategy-Bad-difference-matters/dp/1846684803.
Smith, T., 2015. What exactly do we mean by “shareholder value”? FT. Available at: https:/http://www.ft.com/content/463abec2-9721-11e4-845a-00144feabdc0 [Accessed June 1, 2017].
Statista, 2017. Forecast: footwear and leather goods store retail revenue Germany 2020. Available at: https:http://www.statista.com/forecasts/392074/germany-footwear-and-leather- goods-store-retail-revenue-forecast-nace-g4772 [Accessed May 10, 2017].
Statista, 2017. Forecast: footwear and leather goods store retail revenue Germany 2020. Available at: https:http://www.statista.com/forecasts/397490/united-kingdom-footwear-and- leather-goods-store-retail-revenue-forecast-nace-g4772 [Accessed May 10, 2017].
Statista, 2017. Footwear purchase trend in the UK 2005-2016. Available at: https:/http://www.statista.com/statistics/300845/annual-expenditure-on-footwear-in-the- united-kingdom-uk/ [Accessed May 10, 2017].
Statista, 2017. Footwear in the United Kingdom (UK). Available at: https:/http://www.statista.com/study/25992/footwear-in-the-united-kingdom-uk-statista- dossier/ [Accessed May 10, 2017].
Statista, 2017. Footwear in the UK Dossier.
Statista, 2017. Apparel market in the United Kingdom (UK). Available at: https://www.statista.com/study/20815/apparel-market-in-the-uk-statista-dossier/ [Accessed May 10, 2017].
Stevens, B., 2016. Has the “death of the high street” been exaggerated? Retail Gazette. Available at: https:http://www.retailgazette.co.uk/blog/2016/09/has-the-death-of-the- highstreet-been-exaggerated/ [Accessed June 3, 2017].
Tetlow, G. et al., 2016. UK economy: GDP growth, interest rates and inflation statistics. Financial Times. Available at: https://ig.ft.com/sites/numbers/economies/uk/ [Accessed June 6, 2017].
Valuation Resources, 2017. Shoe Stores & Footwear Retailers. Available at: http://valuationresources.com/Reports/SIC5661ShoeStores.htm#outlookhttps://www.statis ta.com/outlook/11000000/156/footwear/united-kingdom# [Accessed June 10, 2017].
Woolhouse, M., 2017. Stepping up their game: men’s shoes get a makeover - The Boston Globe. Boston Globe. Available at: https://www.bostonglobe.com/business/2017/05/03/stepping-their-game-men-shoes-get- makeover/ankLTmsRNOYPuOlUEd1aTO/story.html [Accessed June 4, 2017].


