Drilling Engineering Model Solutions to Examination
{`HERIOT-WATT UNIVERSITY
DEPARTMENT OF PETROLEUM ENGINEERING
Examination for the Degree of MEng in Petroleum Engineering
Drilling Engineering
`}
SECTION A
- Cutting Structure (teeth):
- Height and spacing of teeth: drillability/hardness of form
- Soft formations require long widely spaced
- Hard formation require shortclosely spaced teeth
- Teeth hardfacing: abrasiveness of formation
- Height and spacing of teeth: drillability/hardness of form
Bearings
- size:
large or small depends on WOB and rotating hours
- sealed/non-sealed:
sealed results in longer number of rotating hours
- ball/roller/journal bearings:
journal bearings are most resistant to wear and damage but this will depend on the planned WOB and rotating hours
Cone Design
- diameter of cone:
will be controlled by the size of teeth, size of bearings,and requirement for mechanical cleaning in soft formations
- meshing/interfit: requirement for cleaning
- offset:
high offset to give scraping action in soft formations no offset (no scraping) in hard formations.
Fluid Circ.
- number/position of nozzles:
determines the distribution of flow over the bit face
- centre jet:
used mostly in very soft formations
- extended nozzles:
used mostly in soft formations
1b. Performanc Criteria: ROP
Length run Cost/ft
- ROP
useful if run length of run not an issue (10 ft @ 100 ft/hr - good or bad?)
- Length run
useful if ROP not an issue (1000ft @ 1ft/hr - good or bad?)
- Cost/ft
Cost/ft = Bit cost + Rig Rate(Trip time + Drilling time)
Interval Drilled
Cost/ft includes both ROP and length of run therefore the best option Cost/ft can be used in both real time (when to pull the bit) and retro spectively (bit selection). When using retrospectively normalise bit costs, rig rate and trip time since these are not a function of bit per formance
2a. The minimum mudweight is based on the pore pressure and borehole stability considerations and the maximum is based on the fracture pressure of the formation to be drilled.
Formation pore pressure: - Minimum mudweight to avoid Influx
- Include 200 psi overbalance over pore pressure
- However, minimise overbalance to avoid- chip hold down
differential sticking formation damage in reservoir
Borehole Stability: - Minimum mudweight may depend on
instability
- Difficult to quantify analytically and may be based on experience
Formation Frac. Pressure: - Max. mudwt. to avoid Lost Circulation
- Less than Geostatic Pressure (1.0 psi/ft)
2b. Minimum mudweight based on Formation Pore pressure which can be predicted from:
- Pre Drilling information : seismic (formation velocity) “d” exponent (previous wells)
DST/RFT data (previous wells) Production data (reservoir sections) density logs (previous wells)
- Whilst Drilling:
“d” exponent shale density losses influxes
borehole collapse
Maximum mudweight is based on Formation Frac Pressure which can be predicted from :
- Pre Drilling and whilst drilling
- leak off tests
- losses
- from poissons ratio (cores) and pore pressure
3a. (List any four of the following)
Flow Rate Increase - While the mud pumps are circulating at a constant rate there should be a steady flow rate of mud returns. If this flowrate increases (without changing the pump speed) this is a sign that formation fluids are feeding into the wellbore and helping to move the contents of the annulus to the surface.
Pit Volume Increase - A rise in the level of mud in the active pits is a sign that some mud has been displaced from the annulus by an influx of formation fluids. The volume of this influx is equal to the pit gain and should be noted for use in later calculations.
Flowing Well with Pumps Shut Off - When the rig pumps are not oper ating there should be no returns. If the pumps are shut down and the well continues to flow it must be due to a kick. (There are 2 exceptions to this rule (a) thermal expansion of mud in the annulus and
- U tubing effect when mud in drillstring is heavier than mud in annulus). A flow check is often carried out to confirm whether the well is kicking or
Improper Hole Fill-Up During Trips - As mentioned earlier the hole should require to be filled when pipe is tripped out. If it does not take the calculated volume the drillpipe volume has already been replaced by formation fluids
Changes in Pump Pressure - An entry of formation fluids may cause the mud to flocculate and result in a slight increase in pump pressure. As flow continues the lower density of the influx will cause a gradual drop in pump pressure. As the fluid in the annulus becomes lighter the mud in the drillpipe will tend to fall and the pump speed (strokes per min.) will increase. Notice, however, that these effects can be caused by other drilling problems (e.g. washout in drillstring, or twist-off).
Gas Cut Mud - This may be considered as an early warning sign. The mud should be continuously monitored. Any significant rise above background level should be reported. Gas cutting may occur due to:
- drilling in a gas bearing formation with the correct mud weight
- swabbing when making a connection or during trips
- influx due to negative pressure
The detection of gas in the mud does not necessarily mean the weight should be increased. The cause of the gas cutting should be investigated before action is taken.
Drilling Break - An abrupt increase in the rate of penetration should be treated with caution. If drilling parameters have not been changed the increased penetration rate may be attributed to
- change from shale to sand (more porous and permeable and so having a greater kick potential) or
- reduced overbalance (increase in pore pressure). Experience has shown that drilling breaks are often associated with overpressured zones. It is recommended that a flow check is carried out after a drilling
Event Possible Other Cause Flow Rate Increase unbalanced mud column
(control on MW pumped)
Pit Volume Increase surface transfer of mud
Flow when not circulating temperature effect/time
Pump pressure decrease Washout in string
Gas cut mud Percolatiointo bore hole
Drilling Break poss. new formation (circ bottoms up)
4a. OBM
Advantages
- Shale Drilling (Inhibition)
- Lubrication (in extended reach) wells
- Produces Gauge hole (for cementing)
- Reduces Corrosion
- Creates a Thin Mud Cake (preventing diff. stick)
- Increased ROP
- Minimises Reservoir damage
Disadvantages
- High Cost
- Environmentally sensitive
- Complex formulation
- Poor Temp. Stability
- Kick detection difficult
- Special logging tools required
- Rheological control difficult
- Rig Modifications to prevent Leaks
- Removal when cementing is diffi cult
4b. (Two of the Following) Mud density
A sample of mud is weighed in a mud balance. The cup of the balance is completely filled with mud and the lid placed firmly on top. (Some mud should escape through the hole in the lid). The balance arm is placed on the base and the rider adjusted until the arm is level. The density
can be read directly off the graduated scale at the left-hand side of the rider.
Mud densities are usually reported to the nearest 0.1 ppg (lbs per gallon). Other units in common use are lbs/ft3, psi/ft, psi/1000ft, kg/l and specific gravity (S.G.).
Viscosity
Two common methods are used on the rig to measure viscosity:
Marsh funnel: This is a very quick test which only gives an indication of viscosity and not an absolute result. The funnel is of standard dimensions (12" long, 6" diameter at the top, 2" long tube at the bot tom, 3 /16" diameter). A mud sample is poured into the funnel and the time taken for one quart (946 ml) to flow out into a measuring cup is recorded. (Fresh water at 75oF has a funnel viscosity of 26 sec/ quart.) Since the flow rate varies throughout this test it cannot give a true viscosity. Non-newtonian fluids (i.e. most drilling fluids) ex
hibit different viscosities at different flow rates. However the fun nel viscosity can only be used for checking radical changes in mud vis cosity. Further tests must be carried out before any treatment can be recommended.
Rotational viscometer (Figure 6): This device gives a more meaningful measure of viscosity. A sample of mud is sheared at a constant rate between a rotating outer sleeve and an inner bob. The test is con ducted at a range of different speeds, 600 rpm, 300 rpm, 100 rpm etc.
(laboratory models can operate at 6 different speeds). The standard procedure is to lower the instrument head into the mud sample until the sleeve is immersed up to the scribe line. The rotor speed is set at 600 rpm and after waiting for a steady dial reading this value is re corded (degrees). The speed is changed to 300 rpm and again the reading is recorded. This is repeated until all of the required dial readings have been recorded. The results can be plotted and assuming that there is a linear relationship between shear stress and shear rate (i.e. Bingham plastic) the following parameters can be calculated from the graph:
Plastic Viscosity (PV) = D600 - D300 (centipose) Yield Point (YP) = D300 - PV (lb/100 ft2)
Gel Strength
A third property is used to describe the attractive forces while the mud is static. This is called “gel strength”. Gel strength can be thought of as the stress required to get the mud moving. The gel strength can be measured using the viscometer. After the mud has remained static for some time (10 secs) the rotor is set at a low speed (3 rpm) and the deflection noted. This is reported as the “initial or
10 second gel”. The same procedure is repeated after the mud remains static for 10 minutes, to determine the “10 minute gel”. Both gels are measured in the same units as Yield Point (lbs/100ft2). Gel strength usually appears on the mud report as two figures (e.g. 17/25). The first being the initial gel and the second the 10 minute gel.
5a.
- Position the rig - Towed (Semis) or self propelled (ships), set
anchors or establish d.p. and perform seabed inspection,
- Run TGB - run on d.p., 4 guidewires (3/4" dia), has 46"
hole through the centre
- Drill 36" hole - bit plus h.o. run with UGF
- Run PGB and 30" csg - run together
- Cement 30"
- Rig up Diverter* - consists of latch, uniflex joint, riser, tel
escopic joint, diverter
- Drill 26" hole
- Rig down diverter**
- Run HPWHH with 20" Csg, - High pressure housing on top of 20"
casing
- Cement 20" csg
- Run BOP stack-up*** - BOP (hydraulic connector, BOP Rams, Hydril),
LMRP (Hydraulic connector, Ann. preventer plus uniflex joint) Riser and telescopic joint
- Drill 171/2" hole, run cement 133/8" Csg ] All casings land and
- Drill 121/4" hole, run and cement 95/8" Csg ] seal inside 20" hp
wellhead housing
* No diverter - flow at seabed, possible listing of rig with diverter - gas flow at surface, possible washout and ignition
** Well exposed - may run logs over open hole before removing diverter.
*** BOP on well untill all casings set and cemented.
- The major differences between the subsea wellhead and suface systems are:
Component/Function Subsea Surface
BOP on seabed at surface
casing supported on seabed at surface
annulus access only between tubing all annuli and prod. casing, none
between casings
annulus seal all at seabed all at surface
configuration 13 3/8", 9 5/8" and 7 “ stack up of spools land inside HPWHH
BOP removal BOP in place from remove and replace landing HPWHH BOP on every
spool.
6a. Subsurface:
Sensors GR, Resistivity, WOB, RPM, Direction (azimuth and inclination)
Transmitter :
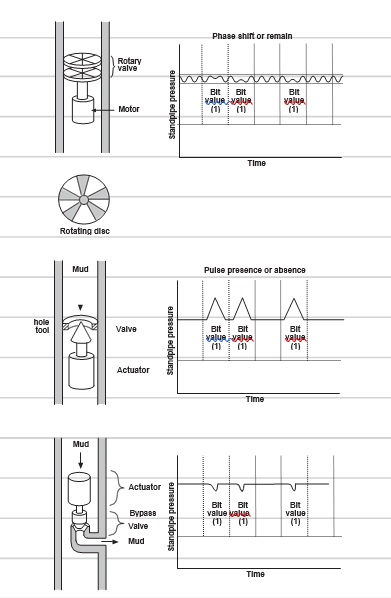
Power Source:
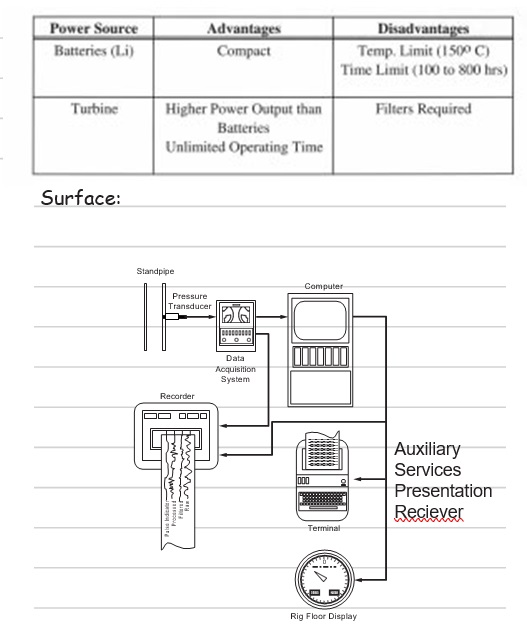
6b. (Four of the following)
MWD tools are very useful for real time identification ofthe forma tions which have just been drilled. If not available can only determine position geologically by circ. bottoms up to retrieve cuttings. This is very time consuming. The tool is therefore widely used for:
- Core point selection
- Casing point selection (when precise placement required)
- Formation correlation when geosteering to stay in the reservoir They are used to replace wireline logging operations saving time
and money.
They are most widely used to provide real time information on bit trajectory (Directional Control) providing more frequent surveys and saving time and money over the conventional survey techniques.
SECTION B
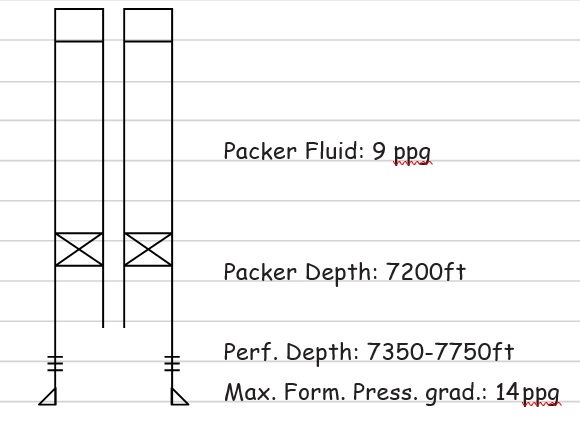
B1 a. Production Casing (9 5/8" @ 10000 ft)
Burst Design - Production :
Internal Load: Assuming that a leak occurs in the tubing at surface and that the closed in tubing head pressure (CITHP) is acting on the inside of the top of the casing. This pressure will then act on the colom of packer fluid. The 9 5/8" casing is only exposed to these pressure down to the Top of Liner (TOL). The liner protects the re mainder of the casing.
Max. Pore Pressure at the top of the production zone
= 14 x 0.052 x 7350
= 5351 psi
CITHP (at surface) = Pressure at Top of Perfs - pressure due to colom of gas (0.115 psi/ft)
= 5351 - 0.115 x 7350
= 4506 psi
Pressure at Top of Packer = CITHP+ hydrostatic colom of packer fluid
= 4506 + (9 x 0.052 x 7200)
= 7876 psi
External Load: Assuming that the minimum pore pressure is acting at the packer depth and zero pressure at surface.
Pore pressure at the Packer
= 9.5 x 0.052 x 7200
= 3557 psi
External pressure at surface = 0 psi
SUMMARY OF BURST LOADS
|
DEPTH EXT. LOAD |
INT. LOAD |
NET LOAD |
DESIGN LOAD (LOAD X 1.1) |
|
Surface 0 |
4506 |
4506 |
4957 |
|
Packer 3557 |
7876 |
4319 |
4751 |
|
(7200 ft) |
Collapse Design - Drilling
Internal Load: Assuming that the casing is totally evacuated due to gaslifting operations
Internal Pressure at surface = 0 psi Internal Pressure at Top of Packer = 0 psi
External Load: Assuming that the maximum pore pressure is acting on the outside of the casing at the Packer
Pore pressure at the Packer = 9.5 x 0.052 x 7200
= 3557 psi
External pressure at surface = 0 psi
SUMMARY OF COLLAPSE LOADS
DEPTH EXT. LOAD INT. LOAD NET LOAD DESIGN LOAD
(LOAD X 1.1)
|
Surface |
0 |
0 |
0 |
0 |
|
Packer |
3557 |
0 |
3557 |
3913 |
|
(7200 ft) |
CASING SELECTED 9 5/8” 47 LB/FT L-80 VAM
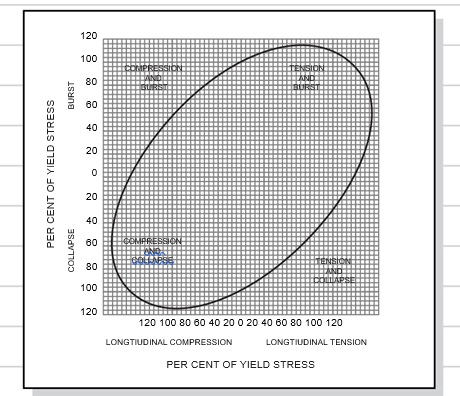
B1 b. It has been established that an axial load can affect the burst and collapse ratings of casing. This is represented in the Figure below. It can be seen that as the tensile load imposed on a tubular increases the collapse rating decreases and the burst rating increases. It can also be seen from this diagram that as the compressive loading in creases the burst rating decreases and the collapse rating increases. The burst and collapse ratings for casing quoted by the API assume that the casing is experiencing zero axial load. However, since
casing strings are very often subjected to a combination of tension and collapse loading simultaneously, the API has established a relationship between these loadings.
The Ellipse shown in the Figure below is in fact a 2D representation of a 3D phenomenon. The casing will in reality experience a combination of three loads (Triaxial loading). These are Radial, Axial and Tangen tial loads. The latter being a resultant of the other two.
B1 c. The conventional wellhead system provides the following functions:
Suspend the weight of the casing -
the casing is generally landed in the wellhead spools in tension. the total weight of the casing strings will be transmitted down through the wellhead spools and housing into the
surface casing.
Seal off the casing annulus at surface -
the annulus between casing strings is sealed off at the bottom of the casing by cement
the annuli at surface are sealed by elastomer seals on the casing hanger.
Provide access to the Annulus between the casing strings -
access to the annulus will allow any pressure in the annulus to be monitored and if necessary bled off. These pressures may originate in open formations above the top of cement in the annulus. This is particularly important if the build up is due to gas.
B2 a.
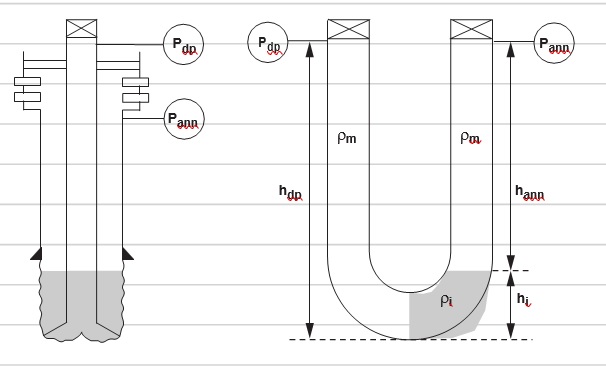
- KILL MUDWEIGHT
Bottom hole press= (8000 x 12x 0.052) + 600
= 5592 psi
kill mud = 5592/8000
= 0.699 psi/ft
= 13.44 ppg
(if 200 psi overbalance is added kill mudweight = 0.724 psi/ft)
With 200 psi overbalance the kill mudweight is close to the LOT pres sure at the previous shoe.
- NATURE OF INFLUX 20 bbls pit gain
Capacity hole/collars = 0.0323 bbls/ft
300 ft collars = 300 x 0.032 = 9.69 bbls Therefore (20 - 9.69) = 10.31 bbls of influx opposite d.p. Capacity d.p/hole = 0.045 bbls/ft
10.4 / 0.045 = 229 ft.
Total height of influx = 529 ft.
(Influx occupies annulus to 231 ft above top of collars)
(12 x 0.052 x hdp) + 600 = 750 + (12 x 0.052 x (d- hi)) + ri x 0.052 x hi
180 = 27.5 ri
ri = 6.55 ppg
ri = 0.34 psi/ft ( probably oh…
B2 b. The one circulation method can be divided into 4 phases (See Figure B2.1).
Phase I (displacing drillstring to heavier mud)
As the driller starts pumping the kill mud down the drillstring the choke is opened. The initial circulating pressure will be Pc1. The choke should be adjusted to keep the standpipe pressure decreasing until all of the drillpipe is full of killweight. In fact the pressure is reduced in steps by maintaining standpipe pressure constant for a period of time, then opening it more to allow the pressure to drop inregularincrements. Once the heavy mud completely fills the drillstring the stand pipe pressure should become equal to Pc2. The pressure on the annulus usually increases during phase I due to the reduction in hydrostatic pressure caused by gas expansion in the annulus.
Phase II (pumping heavy mud into the annulus until influx reaches the choke)
During this stage the choke is adjusted to keep the standpipe pressure constant (i.e. standpipe pressure = Pc2). The annulus pressure will vary more significantly than in phase I due to 2 effects:
- the increased hydrostatic head due to the heavy mud will tend to reduce
- if the influx is gas, the expansion will tend to increase Pann due to the decreased hydrostatic head in the
The profile of annulus pressure during phase II therefore depends on the nature of the influx (see Figure B2.2).
Phase III (time taken for all the influx to be removed from the annulus)
As the influx is allowed to escape the hydrostatic pressure in the annulus will increase due to more heavy mud being pumped through the bit to replace the influx. Therefore, Pann will reduce significantly. If the influx is gas this reduction may be very severe and cause vibrations which may damage the surface equipment (choke lines and choke manifold should be well secured). As before the standpipe pressure should remain constant.
Phase IV (stage between all the influx being expelled and heavy mud reaching surface)
During this phase all the original mud is circulated out of the annulus and is replaced by a full column of heavy mud. The annulus pressure will reduce to 0, and the choke should be fully open. The standpipe pressure should be equal to Pc2. To check that the well is finally dead the pumps can be stopped and the choke closed. The pressures on drillpipe and annulus should be 0 (if not continue circulating). When the well is dead open the annular preventer, circulate and condition the mud prior to resuming normal operations. (A trip margin of 0.2 - 0.3 ppg may be added to the mud weight to allow for swabbing effects when pulling out of hole).
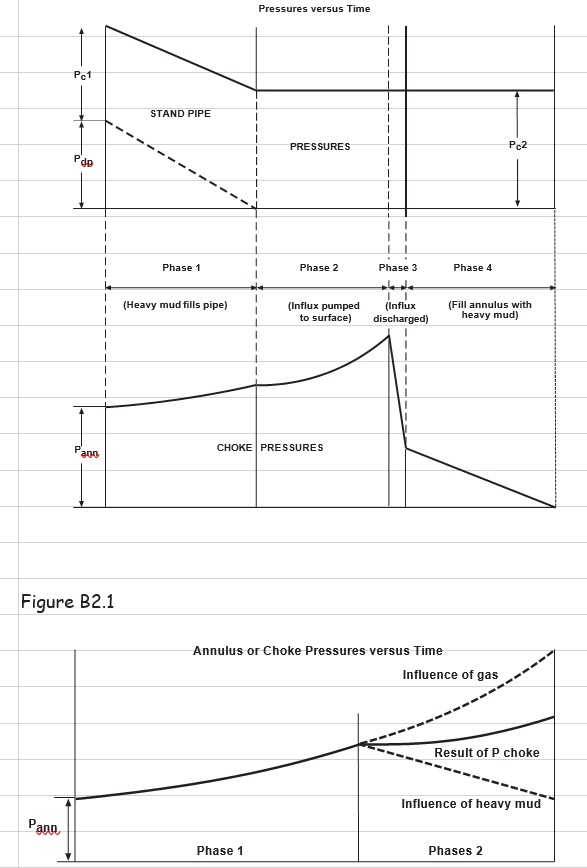
Figure B2.2
B2 c.
- An internal BOP must be available on the
- Adequate Barite must be on site to kill the well. If OBM it must be possible to condition the mud sufficiently to accept the
- If drilling a particularly ‘high pressure’ well a pit of heavy weight mud could be made upand ready for
- The drilling crew should be trained in detecting a kick and well killing operations
- The drilling crew should be trained in ‘stripping into’ a
- Regular ‘kick drills’ should be conducted to determine the crews state of
- The BOP stack should be tested regularly (once a week)
B3a
Calculate displacement of target:
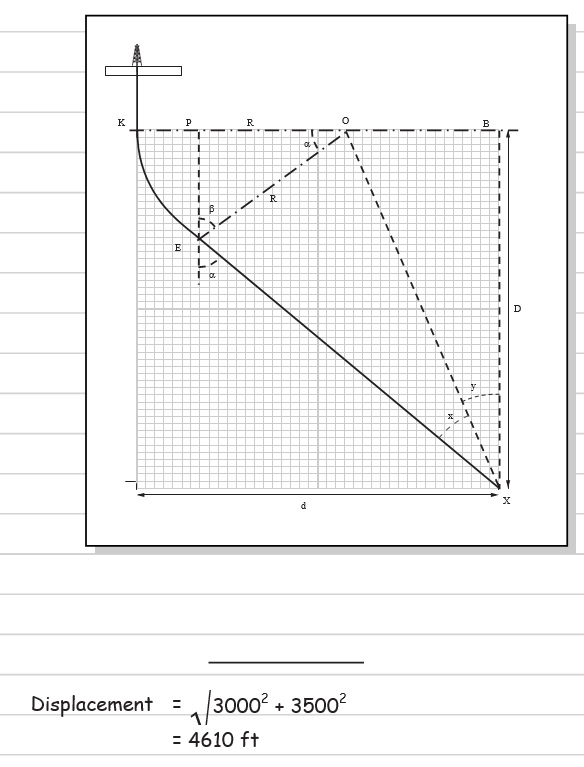
- DRIFT ANGLE:
2.5 R = 360
100 2p
R = 360 x 100 (Radius of BU Section)
5.0 x p
= 2292 ft
(i) Tan y = 4610 - 2292 = 2318
5500 5500
y = 22.85o
- Siny = OB = 2318
0X 0X
0X = 5969.3 ft
- Sinx = R OX
= 2292
5969
x = 22.60
a = x + y
= 45.4o (Drift/Tangent Angle)
- TVD and Displacement
b = 180 - 90 - a
= 44.6o
Cos b = PE = 0.712 EO
PE = 1632
TVD (E) = 4132 ft
Sin b = PO R
PO = 1609 ft
KP = KO - PO
= 2292 - 1609
= 683 ft Displacement (E) = 683 ft
- Total Along Hole Depth
a = KE
360 2p x 2292
0.1261 = KE
14401
KE = 1816 ft
Total AH = 2500 + 1816 + EX
EX = OX cosx
= 5969 x 0. 7022
= 551 ft
Total AH depth = 9826.64 ft
B3 b. Formations (BUR, hole angle):
Borehole Stability, mud requirements Casing scheme , KOP, Doglegs, Shape, Max. Angle, BUR
Specification of Target, Size and Shape
The location, size and shape of the target is usually chosen by geologists and/or reservoir engineers. They will give the geographical
co-ordinates, true vertical depth and specify the size of the target(e.g. radius of 100'). In general the smaller the target area, the more directional control required, and so the more expensive the well will be.
Rig Location
The position of rig must be considered in relation to the expected geological strata to be drilled (e.g. salt domes, faults etc.). When developing a field from a fixed platform the location is critical in order to cover the full extent of the reservoir.
Location of Adjacent Wells
Drilling close to an existing well is highly dangerous. This is especially true on offshore platforms where the wells are very closely spaced.
The proposed well must be deflected or nudged away from all adjacent wells.
Casing and Mud Programmes
In highly deviated wells rubber drillpipe protectors may be installed to prevent casing wear. To avoid drilling problems the mud properties have to be monitored closely. Some operators prefer to use oil based mud in directional holes to provide better hole conditions.
Hole Size
Larger hole diameters are preferred since there is less natural tendency to deviate, resulting in better control of the well path.
Geological Section
The equipment and techniques involved in controlling the deviated wellpath are not suited to certain types of formation. It is for example difficult to initiate the deviated portion of the well (kickoff the well) in unconsolidated mudstone. The engineer may therefore decide to
drill vertically through the problematic formation and commence the deviation once the well has penetrated the next most suitable formation type. The vertical depth of the formation tops will be provided by the companies geologists.
5b. Gyroscope Advantages
Use in pipe/casing no monels required accurate
provides true north
Disadvantages complicated tool
requires surface alignment
Magnetic Compass:
Advantages simple
requires monel collars cheap
Disadvantages
can’t use in csg./pipe magnetic not true north
B4.a.
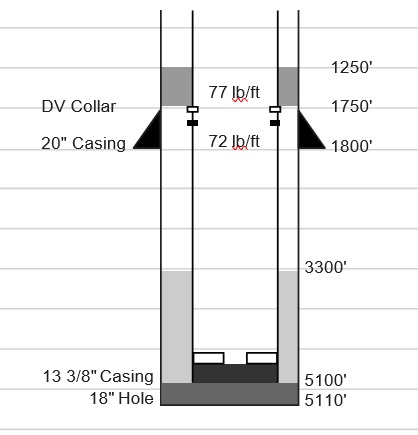
a. No. sxs cement
77 lb/ft
72 lb/ft
1250'
1750'
1800'
3300'
5100'
5110'
Stage 1:
Slurry volume between the casing and hole:
13 3/8" csg/ 17 1/2" hole capacity = 0.7914 ft3/ft annular volume = 1800 x 0.7914
= 1425 ft3
plus20% excess = 285 ft3 Total = 1710 ft3
Slurry volume below the float collar:
Cap. of 13 3/8, 72 lb/ft csg = 0.8314 ft3/ft
shoetrack vol. = 60 x 0.8314
Total = 50 ft3
Slurry volume in the rathole:
Cap. of 17 1/2" hole = 1.7617 ft3/ft
rathole vol. = 10 x 1.7617
= 17.6 ft3
plus 20% = 3.5 ft3
Total = 21.1 ft3
TOTAL SLURRY VOL. STAGE 1 : 1781 ft3
Yield of class G cement for density of 15.8 ppg = 1.15 ft3/sk
TOTAL No. SXS CEMENT STAGE 1: 1781/1.15 = 1549 sxs
Stage 2:
20" csg/ 13 3/8" csg = 1.019 ft3/ft
annular volume = 500 x 1.019
= 510 ft3
TOTAL SLURRY VOL. STAGE 2 : 510 ft3
Yield of class G cement for density of 13.2 ppg = 1.89 ft3/sk
TOTAL No. SXS CEMENT STAGE 2: 510/1.89 = 270 sxs
- Amount of mixwater
Stage 1:
mixwater requirements for class G cement for density of 15.8 ppg
= 0.67 ft3/sk
Mixwater required = 1549 x 0.67
= 1038 ft3
Stage 2:
mixwater requirements for class G cement for density of 13.2 ppg
= 1.37 ft3/sk
Mixwater required = 270 x 1.37
= 370 ft3
- Displacement Volumes Stage 1:
Displacement vol. = vol between cement head and float collar
= 0.148 (bbl/ft) x 5040 = 746 bbl (add 2 bbl for surface line) = 748 bbl
Stage 2:
Displacement vol. = vol between cement head and stage
collar
= 0.148 (bbl/ft) x 1750 = 259 bbl (add 2 bbl for surface line) = 261 bbl
B4. b.
Run casing with centralisers and possibly scratchers Circulate casing contents (x 2)
First stage - The procedure is similar to that for a single stage operation, except that no wiper plug is used ahead of the cement :
- pump spacer ahead of cement
- pump cement
- release shut-off plug
- displace with spacer and low yield mud
A smaller volume of slurry is used, so that only thelower part of the annulus is cemented and only a second wiper plug is used. The height of this cemented part of the annulus will depend on the fracture gradient of the formation (a height of 3000' - 4000' above the shoe is common).
Second stage - This involves the use of a special tool known as a stage collar, which is made up into the casing string at a pre- determined position. (The position may be fixed by the depth of the previous casing shoe.) There are ports in the stage collar which are initially closed by an inner sleeve, held by retaining pins. After
the first stage is complete a special dart is released form surface which opens the ports in the stage collar allowing direct communication between casing and annulus. (A pressure of 1000 - 1500 psi is applied to allow the dart to shear the retaining pins and move the sleeve down to uncover the ports.) Circulation is established through the stage collar before the second stage slurry is pumped. The normal procedure is as follows:
- drop opening dart
- pressure up to shear pins
- circulate though stage collar
- pump spacer
- pump second stage slurry
- release closing plug
- displace cement with mud
- pressure up on plug to close ports in stage
To prevent cement falling down the annulus a cement basket or packer may be run on the casing below the stage collar.
The quality of a cement job can generally be improved by :
- centralising the casing - most important
*reciprocating or rotating the casing - not possible to rotate in most cases (except for liners) but reciprocation is quite common.
- circulating spacers- formulated so that they induce turbulence
- circulating at a high velocity - to ensure total mud removal
One disadvantage of stage cementing is that the casing cannot be moved after the first stage cement has set in the lower part of the annulus. This increases the risk of channelling and a poor cement bond.
4 c. The two stage operation are used t reduce the height of heavy weight cement colom in the annulus. This may be done for several reasons:
- to reduce the total hydrostatic head on the bottom of the hole and therefore prevent lost circulation when cementing. Lost circulation mat result in the TOC being too low and problem formations being exposed in the
- to ensure that vcement is placed across the previous casing shoe. This may be required when abandoning the well. Without a two stage operation the entire openhole section of the annulus would have to be
- To reduce the amount (and therefore cost) of cement


