LAB for Week 6: Evolution of Chocolate Candies
Classification and Macroevolution
Last week you learned about Natural Selection, DNA, and heredity. Here are some important take-a-ways:
- Genetic variation within a species or a population is a prerequisite for a short-term or a long-term evolutionary change.
- Various factors are known to cause changes in the genetic makeup of the next generation. Mutation is how new change occurs, through alterations in DNA.
- Most variation is “meaningless” – it does not affect our ability to survive or adapt. However, some variation is positive – it improves our ability to survive or adapt (Natural Selection).
- You also learned how Mendel discovered the inheritability of traits (principles of inheritance).
- How Darwin arrived at his theory of natural selection, including surviving to reproduction (living long enough to have offspring), and traits that enhance adaptation and reproductive success; and finally,
- There are forces of evolution, i.e., factors that produce and redistribute variation.
- WATCH: Short video on the Evolution in Action-
https://www.youtube.com/watch?v=GIGXLNYV9kc
- WATCH: Short video on the Forces of Evolution- https://www.youtube.com/watch?v=5NdMnlt2keE
- READ: Chapter 5 of your textbook- See my notes and goals for you for this chapter in this handout.
- WATCH: Short Video on how to construct a Cladogram- https://www.youtube.com/watch?v=ouZ9zEkxGWg
- SHORT LAB: AT THE VERY END OF THIS HANDOUT, you will find the instructions for your lab. You may want to purchase a bag of assorted chocolate candy for the lab, but it is not required.
- Your graded work includes your reading notes (3 points) and your lab (5 points) at the end of this handout.
- You may complete the lab with another student.
Your goals for Chapter 5:
Organisms can be classified according to any number of criteria, including overall similarities, colors, ecological functions, etc. However, it is generally agreed that the most useful way for scientists to organize biological diversity is to group organisms according to shared evolutionary history. This way the grouping not only results in an organized classification, it also contains and conveys information about our understanding of the evolutionary history of these groups.
Classification:
Principles of classification
- Shared evolutionary descent
- Homologous characteristics
- How does this differ from analogous traits?
Constructing Classifications and Interpreting Evolutionary Relationships
- There are several methods that have been used to work out the evolutionary relationships of organisms. The most successful of these is the so-called "cladistic" or "phylogenetic" method.
- Cladistic methodologies (is based on what and who uses this method)-
- What is an ancestral trait?
- What are shared derived or modified characters?
- Know the term clade.
Definition of a Species-
Recognition of a fossil species:
- Consider why it’s harder to define extinct species biological boundaries (i.e., how closely related they are to new fossil finds or similar species that is from a different time period).
- Lumpers- I am a “lumper” philosophically speaking, I assume speciation is less common in evolutionary history (of humans and our fossil ancestors). Other researchers are splitters and view speciation as having occurred more frequently.
- Know the term ecological niche.
- Know the term genus.
Understand how fossils are formed.
Consider how some environments are conducive to creating fossils while others are not.
Know the following:
- Process of Macroevolution-Adaptive Radiation
- Difference between specialized and generalized characteristics
- Difference in micro and macroevolution.
Please note that further information on how to construct a cladogram follows, in the event you don’t remember it from your last biology Assignment. The actual lab is at the end.
Diagraming Evolution, or How to read a Cladogram
by Patrick on 8 December, 2010 in Patrick's Ponderables
(the first 3 pages of this handout was adapted from the source listed above)
Remember the Linnaean system of classification you probably learned in grade school or high school (heck, maybe even college)? It went something like this…
Kingdom -> Phylum -> Class -> Order -> Family -> Genus-> Species
Linnaeus started using this classification system in the 1700s and he had a good run; we still use his system in certain situations. However, we’ve moved away from this ranking system mostly because of the discovery of transitional fossils that screwed with Linnaeus’s idea of neat little boxes for all of life to be categorized into. This system falls apart, for example when you have two equivalent ranks, let’s say class Osteichtyes (boney fish) and class Amphibia (amphibians), and find a transition between the two. In the case of our example, let’s say we find a transitional fossil like Tiktaalikwith both fish and amphibian characteristics. Now what? Does this thing belong to class Osteichtyes or class Amphibia? Which box do we put it into? For reasons like this, most modern evolutionary biologists prefer to organize species on a diagram called a cladogram. These take a little getting used to but once you understand them, they give a person a much better sense of how evolution is operating.
Cladograms are branching diagrams where each branch represents an evolutionary lineage. We put the names of specific taxa at the end of each branch and we put the names of groups to which those taxa belong at the intersection of branches (nodes). Check out the example below that uses mammals.
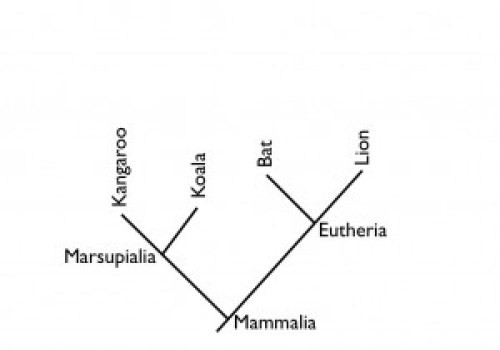
- Mammals are the vertebrates within the class Mammalia (/məˈmeɪliə/ from Latin mamma "breast"), a clade of endothermic amniotes distinguished from reptiles (including birds) by the possession of a neocortex (a region of the brain), hair, three middle ear bones, and mammary glands.
- Marsupials are any members of the mammalian infraclass Marsupialia. A mammalian order whose members are born incompletely developed and are typically carried and suckled in a pouch on the mother's belly. Marsupials are found mainly in Australia and New Guinea, although three families, including the opossums, live in America.
- Eutherians make up the largest of the three mammal lineages. This lineage is composed of all extant placental mammals (Placentalia) and all extinct nonplacental animals that are more closely related to the Placentalia than they are to other two mammal lineages. Metatheria (the marsupials) and Monotremata (the egg-laying mammals).
The diagram (above) doesn’t really have axes, but implied in the x direction is some sort of evolutionary distance from each other and implied in the y direction is relative time (the first branch at the bottom happened long ago the latter branches higher up happened more recently). This diagram tells you that all the animals listed are mammals (see the group name Mammalia at the bottommost node). The koala and kangaroo are more closely related to one another than to anything else on the diagram. Their branches intersect each other before they intersect any other lineage. This indicates that they diverged from each other more recently than they diverged from any of the other animals on the diagram. Furthermore, they both belong to the group Marsupialia. Similarly, the bat and the lion are more closely related to each other than they are to either of the marsupials. They are both placental mammals (eutherians).
Now let’s try a slightly more complicated example…
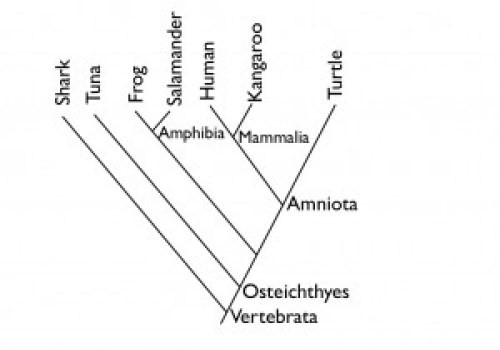
Here we can see some interesting relationships. Notice you (assuming you are a human) are more closely related to a turtle than you are to a frog (you and the turtle are both amniotes, part of the group Amniota). Now, as you work your way down the diagram things start to really get interesting. The tuna is more closely related to humans than it is to sharks. Surprising right? I know what your thinking “Is that really true?” Sure it is. See the distance between the ‘Vertebrata’ node and the ‘Osteichtyes’ node? That distance is shared evolution between humans and tunas that sharks don’t share (they’ve already branched off). Put another way, this means that tunas and humans have a few extra million years of evolution in common that tunas and sharks don’t. The fact that sharks and tunas both live in the ocean and kinda look a lot alike doesn’t count for all that much.
As long as we are examining this diagram notice that the Linnaean ranks we used before as equivalent, Osteichthyes and Amphibia, are certainly not equivalent on this diagram. Amphibia is contained within Osteichthyes. In fact, all land dwelling vertebrates are within Osteichthyes (this is why some evolutionary biologists are fond of saying we’re all ‘fish’).
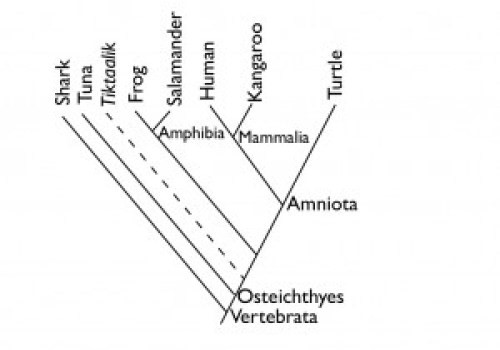
Now finally, I’ll show you where Tiktaalik fits on the cladogram. It’s closer to being an amphibian than to being a tuna, but then again it’s just as close to being human as it is to being an amphibian.
Bottom Line:
Cladograms are diagrams which depict the relationships between different groups of taxa called “clades”. By depicting these relationships, cladograms reconstruct the evolutionary history (phylogeny) of the taxa.
Cladograms are constructed by grouping organisms together based on their shared derived characteristics.
On the next pages, you will see alternative examples of cladograms (drawn a little differently). You will also see how the characteristics were used to create the cladogram.
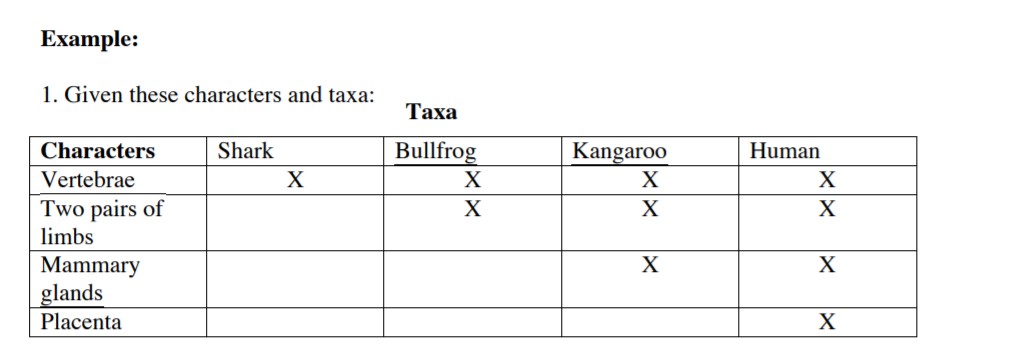
Now, lets out these taxa within nested boxes called a Venn Diagram. This diagram is a pictorial representation of logical sets, pictorially represented as circles or closed curves within an enclosing rectangle.
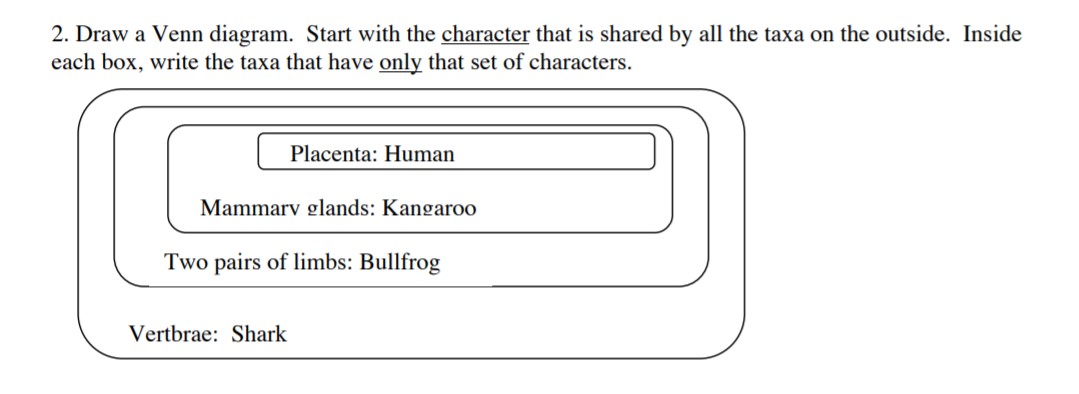
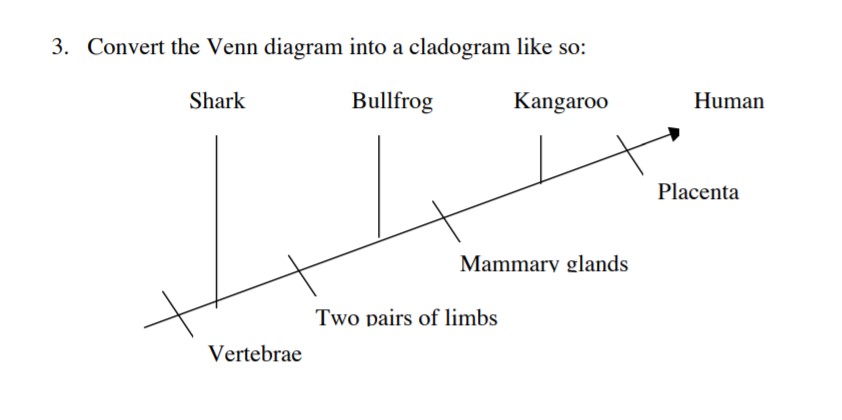
Based on this cladogram, we know that humans are more closely related to kangaroos then to a bull frog. They are the vertebrates within the class Mammalia (because both organisms have mammary glands). It is important to note that on the cladogram, every organism identified past the evolutionary trait of mammary glands must have that trait. Similarly, every organism added after placenta would need to be a placental mammal. So koalas, which have mammary glands, but are not placenta mammals, would be added next to kangaroos.
Let’s look at a cladogram of humans and other living primates.
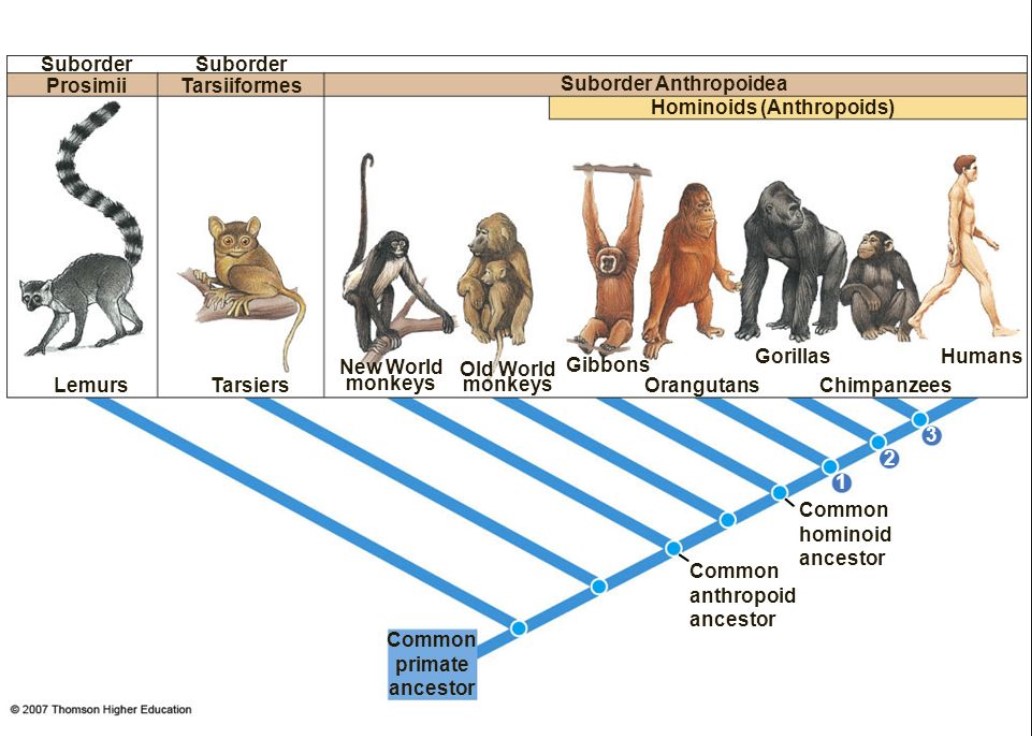
Does this cladogram depict the relationships between different groups of taxa? By depicting these relationships, does it reconstruct the evolutionary history (phylogeny) of the taxa? Yes, the cladogram of primates is based on homologous physical traits and genetic similarities that are derived from having a shared common ancestor at some point in the past. Does this mean humans evolve from modern monkeys? No, it does not, but if you trace the branches of our family tree far enough, you'll realize that we share a common ancestor. Later in this Assignment, you will learn about the physical traits and genetic code that we share with other primates.
Here is one last example that may “ring” more clearly to you. It doesn’t represent a living organism but clearly applies physical traits to show shared technological relationships.
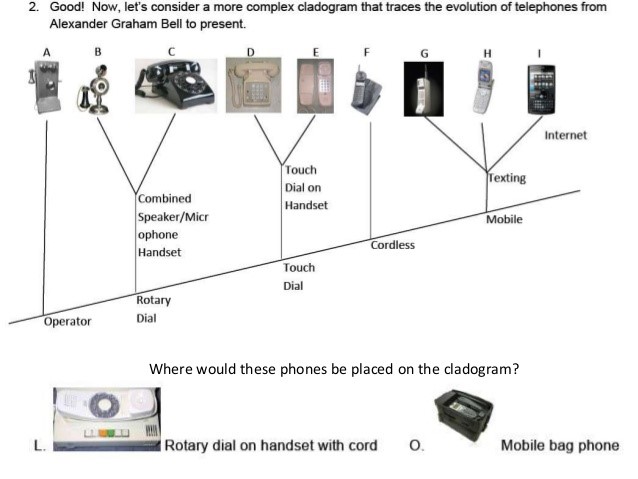
Notice how the oldest phone is the first (on the left). Followed by the next oldest with two types branching at the top, suggesting they shared an ancestor at some point and share traits in common with each other (rotary dial). They have more in common with each other than the later phones that poses “advanced” or “derived” traits. The further away a specimen is away from the root of the tree, the more changes have occurred. So, the I-phone “I” at the far right is the most unlike to the old wall phone on the left. In other words, they are the least “alike” in this cladogram.
(the lab is on the next page)
LAB for Week 6: Evolution of Chocolate Candies
|
EXAMPLE CANDIES: | ||||
|
Hershey's Kisses |
Snickers |
Milky Way |
Baby Ruth |
Twix |
|
Krackel |
Three Musketeers |
Mint Three Musketeers |
Mr. Goodbar |
Reese's Peanut Butter Cups |
In this activity, you will construct a cladogram, like Mr. Anderson did in his video (so watch it now if you have not https://www.youtube.com/watch?v=ouZ9zEkxGWg). You will need to apply your critical thinking and analysis skills for this activity, because sometimes there is more than meets the eye when trying to use characteristics to create an evolutionary tree for a group of like organisms (or candies in this case). You don’t need the actual candies in front of you to do this lab, just knowledge of the candies you select.
- Pick seven or eight types of chocolate candies. At least one should be plain chocolate, the others should have other ingredients or multiple traits.
- Describe your sample population of candy. As a scientist, you need gather and analyze data from various sources to construct you tree, so too must you collect data about your specimens! So, make a list of the traits for each candy The main ingredients maybe easiest trait to analyze but it could be size and texture. If you chose main ingredients, you would write: A. SNICKERS: milk chocolate, nougat, caramel and peanuts; B. TWIX: chocolate, caramel and cookie. It is not necessary to read the package label to determine what these ingredients in detail.
- Create Cladogram. When constructing a cladogram, remember, there must be a root, a common ancestor. We don’t have to know who that common ancestor is.
TO DO THIS, YOU WILL WANT TO HAVE:
- Look for common traits. You can (but are not required to) create a chart of characteristics and taxa (candy bar). Once you have generated your characteristics list, figure out among candy types which specimens you have that have common traits (i.e., ingredients or texture or size).
- Then, figure out which species are the earliest in your cladogram. These will be the specimens most closely related to the root
- As you find that specimens have less and less in common, they will be more distant from each other on the diagram. Place your specimens
- Write a brief summary of your cladogram. In the example cladogram below, the student hypothesis was: “The dark chocolate was the common ancestor to all other chocolate candies in my sample population. From the dark chocolate evolved milk chocolate bars with a branch for the candied shell M&Ms. I considered the candy shell a trait that is separate from the other candy bar types that evolved much later. The later species share nuts as a trait…" Be creative, but be sure that what you come up with is plausible. Remember, you must use some basis to justify the placement of your specimens on the tree you
- What you need to turn in. Put your and any lab partners name at the top of the page, please. Include items 1 through 4 above. Your cladogram can be handwritten, you don’t need to have a picture of your cladogram with the actual candies in the photo. I did that to help you visualize the assignment. Please submit to Ecampus. Lab point value: 5 points.
EXAMPLE Candy Cladogram:
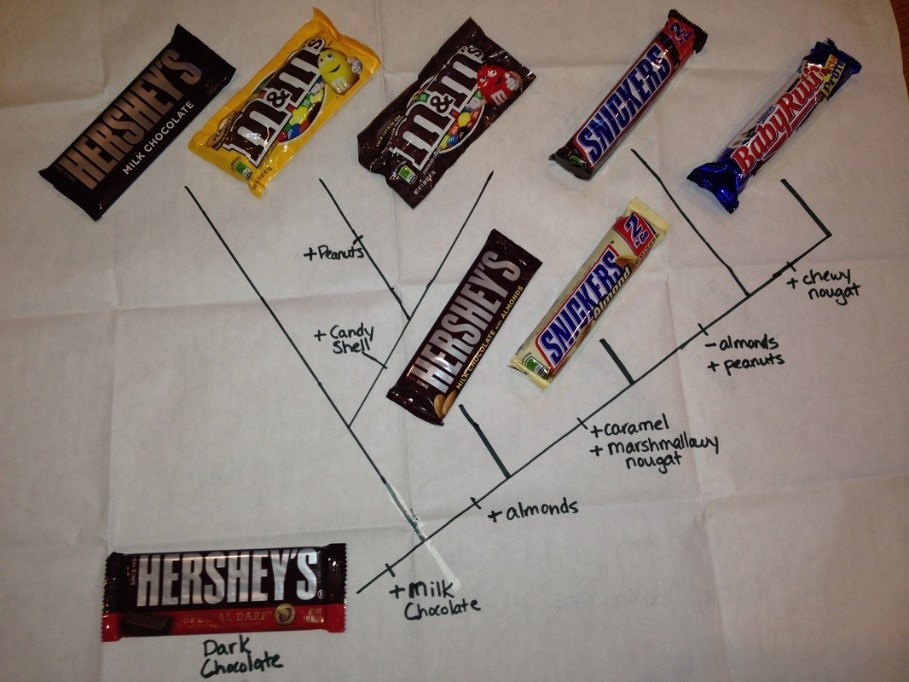
*note, I would replace “almonds” with the word “nuts” after milk chocolate.


