ECON 1269 international trade
ASSIGNMENT 3
Question 1: Country: South Korea, Industry: Rice
In South Korea, Rice cultivation has been developed since 1500-3000 BC (Crawford and Lee, 2003), and it has been one of the main industry. Therefore, Korean Government established some subsidies in order to raise the farm household income and become self-sufficiency in rice. For example, they kept rice market prices higher than world trade price by purchasing the output and banned the rice import.
In 2004, South Korea applied to maintain the special treatment until 2014, Annex 5 section B paragraph 9 in the legal text of WTO agreement. They negotiated with their trading partners (China, Thailand, Australia,…) and “confer additional and acceptable concessions”. In this case, South Korea must double the MMA from 4% to 8% based on the period consumption in 2004.
Additionally, in 2005, according to Yim 2006, the Rice Income Compensation Act established the subsidies for rice farmers, called the Direct Payment Program for Rice Income Compensation. This program consisted of 2 parts. The first one is known as the area payment, based on the size of the land where a farm cultivated rice in a 1998-2001. The other method is named the deficiency payment, which covers the difference between the target price and the average rice price at harvest time.
Barriers to import applied to agricultural trade are used to insulate domestic markets price from world market price variability (Nelgen 2012) so the domestic industry can be protected. South Korea’s barrier to import affected positive and negative 3 types of economic agents, Consumers, Producers and Government.
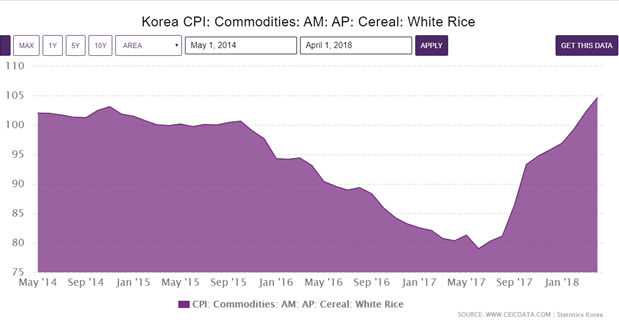
Consumers: They had the disadvantages in short-term because of higher prices. According to Ceidata, the rice price increased since the domestic supplier did not have the foreign competitors. Moreover, the barrier trade policies reduced total goods supply (Begovic 2006) so the consumers had less choice to choose and they had to go back to domestic product.
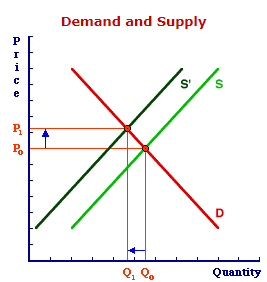
Graph 1: The market price when Supply decreases
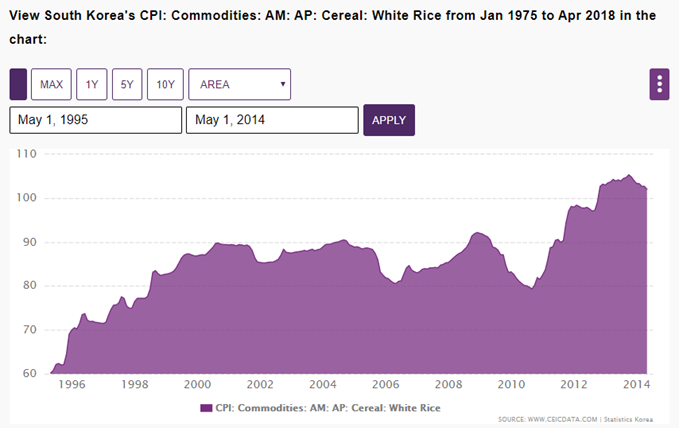
Graph 2: Consumer Price Index white rice in South Korea 1996-2014
However, in the long run, when domestic industry becomes stronger by “learning by doing” concept (the more they produce the more the cost decrease, and the products’ quality increase). The clients could buy domestic rice with cheaper price whenever they want instead of spending time on waiting for foreign Rice. Moreover, Korea residents can know clearly the origin of the rice and feel safe when using products.
Producers: Regarding the producer, the obvious benefit is earning high revenue thanks to the growth in rice price, and having more market share. They can take the time advantage for better innovation Rice by using Government’s subsidies. They also improve productivity by “learning by doing” concept the more they produce the more the cost may decrease. For example, from 1995 to 2012 there was an increase in larger machines, such as tractors which replaced the transplanters.
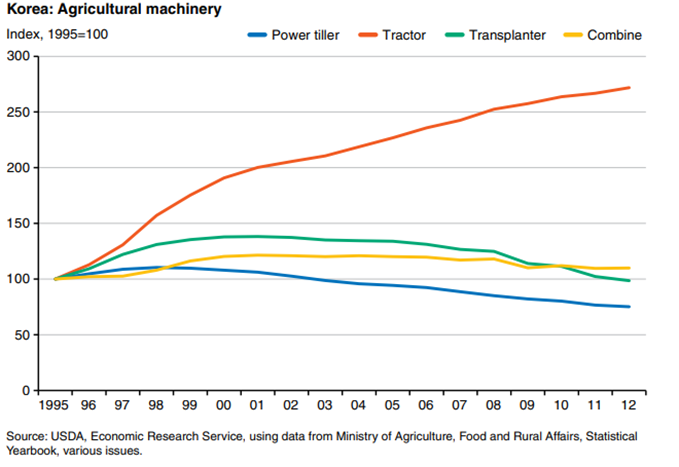
Graph 3: South Korean Agricultural Machinery
Nevertheless, with the barrier to import, domestic companies may have less change for them to learn from foreign competitor, less competitive.
Government: The domestic agricultural employment increase during 5 years after 1995 (world bank, and tradingeconomics).
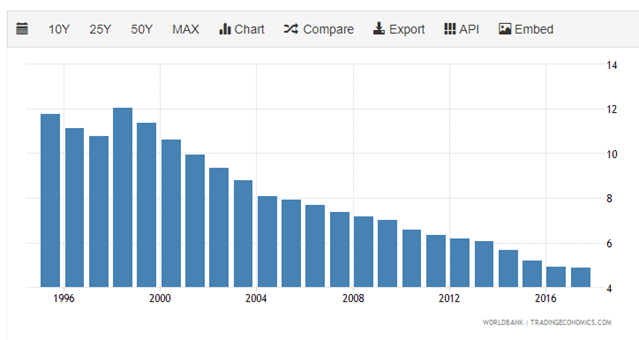
Graph 4: South Korea - Employment In Agriculture (% Of Total Employment)
Source: South Korea tradingeconomics
In addition, South Korea might reduce the dependence on other countries such as Thailand, USA, Australia,.., protect the domestic rice companies and gain more control over their economy, especially exchange rate. When the rice industry becomes stronger, they can export more rice so GDP may grow. However, it may cause inflation, leading to the decrease in real wage and purchasing power. Furthermore, they must pay huge cost such as subsidies for rice producers. The strategy may make the trading relationship become worse, especially leading to retaliation.
However, higher consumer prices, which may lead to the reduction of rice consumption. According to the National Atlas of Korea, between 2004 and 2014, the annual rice consumption declined significantly while the farmer produced the same number of rice.
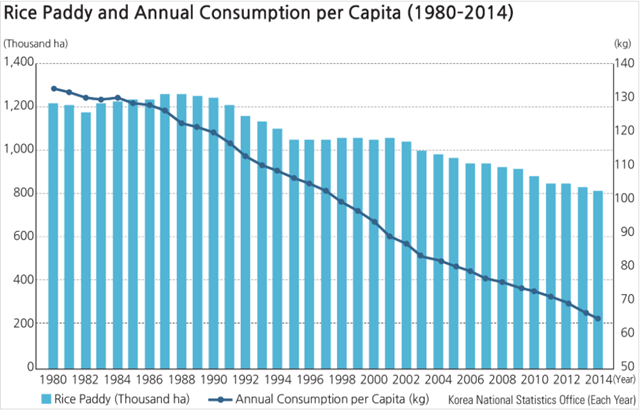 Source: National Atlas of Korea
Graph 5: Rice Consumption in South Korea
Moreover, the amount of rice imported by the MMA (Minimum Market Access) based on the WTO agreement, has increased annually. As a result, during 2005-2014, rice has become rather seriously oversupplied. Therefore, many rice farmers declined their rice crop areas or switched to other vegetables because of a lack of profit. The milled rice production in South Korea decreased gradually instead of increasing like Government intended.
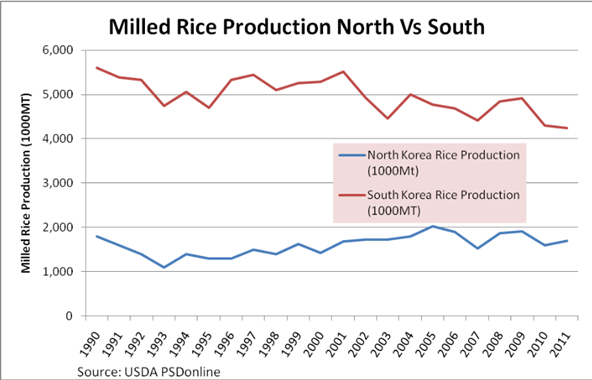
Graph 5.1: Milled rice production in South Korea (1990-2011)
Especially according to the Agriculture Minister, in 2014, South Korea government has changed their policies and the rice imports were liberalized, their minimum access quota must be maintained at 408,000 tons in 2014 with the tariff of 5%. Then, they put very high tariff rate on import rice exceeding the quota (513%) to protect their local companies.
Consumers: When South Korea import rice with 5% tariff under WTO agreement, domestic rice prices declined (Nelgen 2012). They gain benefit from the reduction in the rice price due to the decrease in tariff, and they have more choices to choose.
Graph 6: Price of rice in South Korea
Producers: They must improve their rice quality try their best to survive in the market, and compete with the international companies. They have chances to learn new technologies called as knowledge spillover. The export companies have higher revenue. The domestic suppliers can export rice easier and submit fewer paper-based documents thanks to WTO agreement because the Customs authorities of the WTO members are required to adopt efficient customs procedures to provide product to customers.
Government: They receive the revenue from the tariff. However, with the high tariff rate on importing exceeding rice (513%), their trading relationship may become worse and it can lead to retaliation
Question 2.1. Discuss why Malaysia should/should not use protectionist policies. Extra references should be added.
According to the article “Malaysian Automobiles and the Infant Industry Argument”, we can conclude that Malaysia Government should use Infant Industry Protection Policies, but they must manage reasonably the length of the implementation time.
In 1980s, Malaysian Government established national automobile firm (PROTON). They should use the protective measures to enable the Car Industry to survive and develop because the automobile industry has the potential to grow in the future. It affects the economic development, the industrialization and modernization and the living standard of producing countries significantly (Wells, Peter and Michael Rawlinson,1993). Moreover, the automobile industry development would support others such as steel, rubber, petroleum industries in Malaysia (Mohd. Rosly 2004).
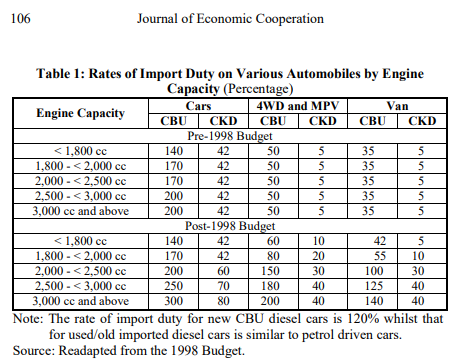
In this case, the Government supported PROTON by investment incentives and barriers to import implementation such as increasing tariff CBU (completely built-up) and CKD (completely knock-down) cars (table 1). Furthermore, they also set tariff rate quota to 5% on 1995, to limit the imported cars.
When the protectionist policies were applied, because the Car supply decreased, the national companies could have more market share, increase their productivity because of “learning by doing”. As a result, when their production increase, their revenue would grow (graph 7).
However, if the government always protects the domestic companies, they would lose the chance for them to learn technologies known as technological transfer or knowledge spillover from foreign competitors. Then, when the Government removed the umbrella shielding, Proton could not remain their position in Car market. In 2004, based on AFTA Agreement, Malaysia must reduce the tariff to 5% for CBU and CKD cars (The Economist London news, 2004). As a result, PROTON, which was protected too carefully, could not compete with others international brands, so their sales reduced dramatically (graph 7).
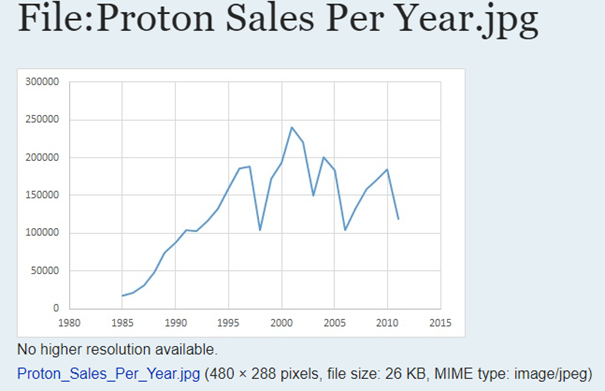
Graph 7: Proton sales from 1985 to 2016
After that, the Government increased the excise duties in 2006 to overwhelm this situation (Mohd. Rosli, 2007). Then, the Proton sales recovered in 2010.
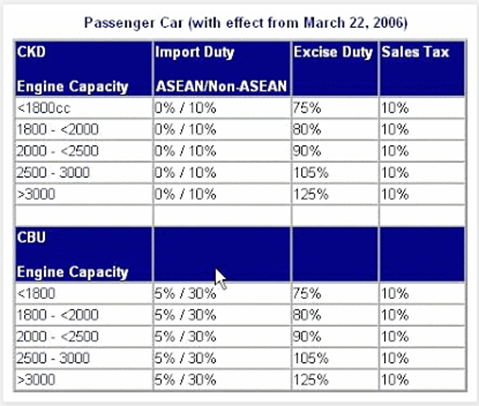
Table 2: Excise duty for car in Malaysia 2006
In case of Perodua, unlike Proton, who familiar with the dominant position in the car market, they already have to compete with the Proton in the beginning period (1990). Therefore, they need to focus on develop their products. As a result, they invented Myvi (2005), which was the backbone of their sales in 2006, brings them to the market leader (2005).
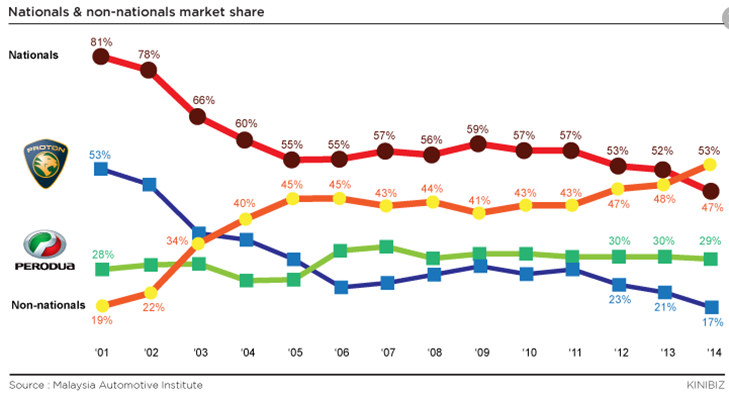
Graph 7.1: Market share of Perodua and Proton 2001 to 2014
In conclusion, Government should protect their domestic industry in short-run, and then reduce the level production over time, to help the local companies create the comparative advantage,and foster the competition.
Question 2.2. The US Government has applied Infant Industry Protection (IIP) in 2018.
The infant industries, the newly small established industries, lack experience to compete with other international companies, but have the potential to grow in the future (Hashimzade, Gareth, John 2017).
IIP (Infant Industry Protection) refers to trade policies implemented by the government to protect the chosen domestic infant industry. There are numerous methods such as restricting import by imposing high tariffs, low quotas or Tariff-rate quotas (TRQ), and giving tax incentives (tax reduction, tax exemption, or tax delay), subsidies to domestic firms, forcing savings, giving FDI incentives, cheap bank loan or direct credit, and investing in R&D.
For examples, the implementation 25% tariff on steel in US. US was the biggest steel importer about 29 billion USD (CNN news, 2017). Canada, South Korea, Brazil, Mexico, and China are the main trading partners of US. The US steel industry depended too much on foreign country.
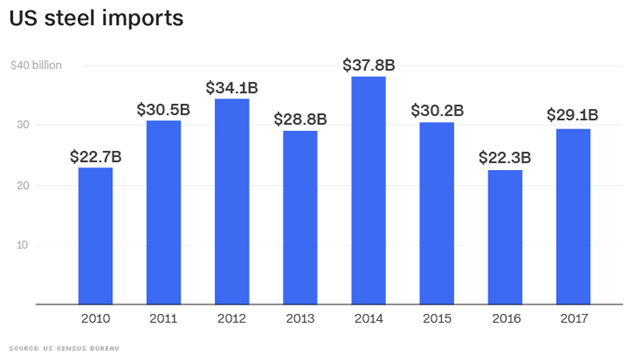
Graph 8: US Steel Import
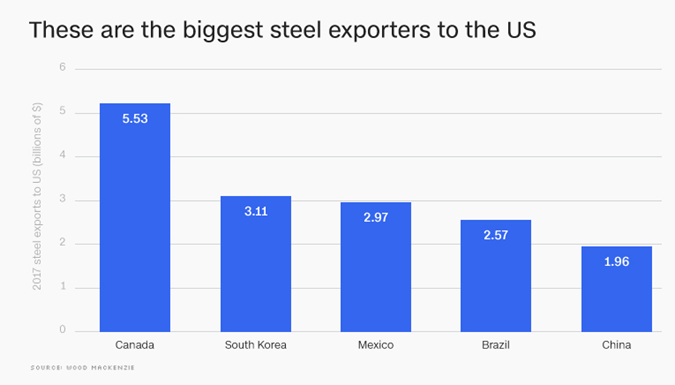
Graph 9: These are the biggest steel exporters to the US
Therefore, in order to revive the US manufacturing, President Donald Trump imposed tariffs 25% on steel and 10% on aluminum imports in March 2018 (Jacob M, Peter and Louise 2018). The tariff has affected negatively and positively the three types of economic agents in US: Consumers, Producers and Government.
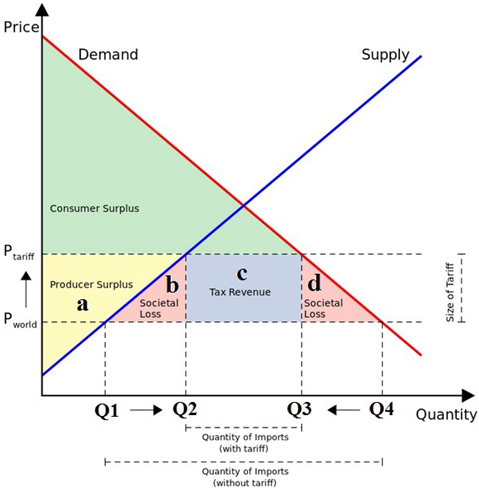
Graph 10: Effect of tariff on market price
Source: https://talkmarkets.com
Consumers: In figure above, after the implementation of the tariff, the price goes up and the total consumption is decreased from Q4 to Q3. The quantity of Imports can decrease (Q1Q4 to Q2Q3) so the tariff may also increase the consumption of domestic steel and reduces the consumption of imported steel.
In graph below, before imposing the steel tariff, the domestic steel prices in 2017 was quite constant. Nonetheless, since 31th December 2017 to March 2018, U.S domestic steel prices witnessed a significant increase. Therefore, USA consumers had disadvantage in the short-term, and they have less choice to choose.
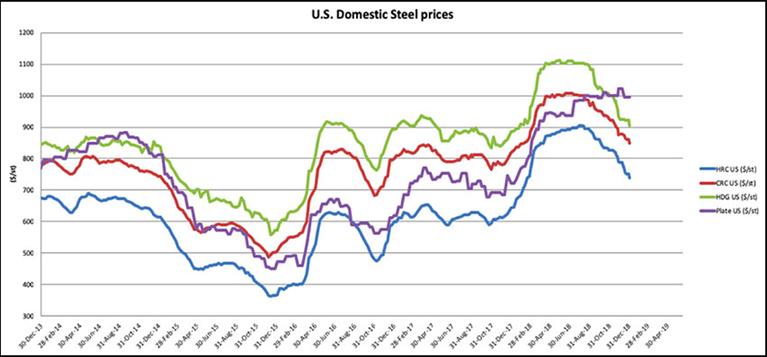
Graph 11: US Domestic steel price–Source: MetalMiner data from MetalMiner IndX(™)
In graph 2, the 25% tariff had the heavy impact on the industries which use steel to create their products (cars, machinery, buildings,..), they must pay higher cost and set higher price for their products to have profit. The reason for that is the growth of the imported steel price and these industries rely on steel (Smith 2018).
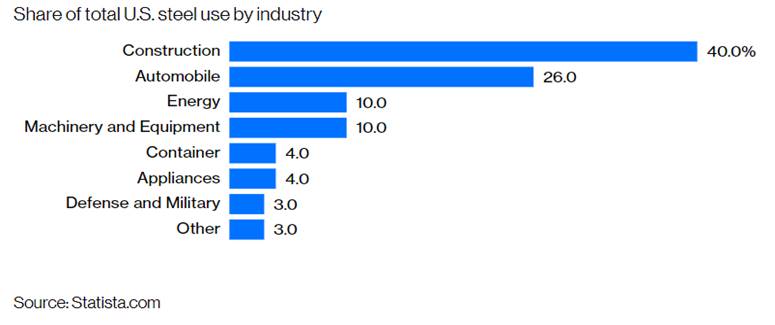
Graph 12 – Share of total U.S steel use by industry
However, in the long run, when domestic industry becomes stronger by “learning by doing” concept, the clients could buy domestic rice with cheaper price whenever they want instead of spending time on waiting for foreign Steel.
Hence, clients have the disadvantage in the short-run, but gain benefit in the long-run.
Producers: When the steel price increases after tariff implementation, the customers are encouraged to purchase steel from domestic producers (Bomey 2018). The producers earn more profit from customers. Furthermore, because of the reduction of quantity import, they get more market share and are able to create more steel for the national demand. When client are familiar with their product, their reputation would be improved in the future.
To illustrate, the graph 3 shows that from April 2018 to July 2018, U.S steel production is mostly higher than the production from April 2017 to July 2017 (noted that the tariff was effective on March 2018).
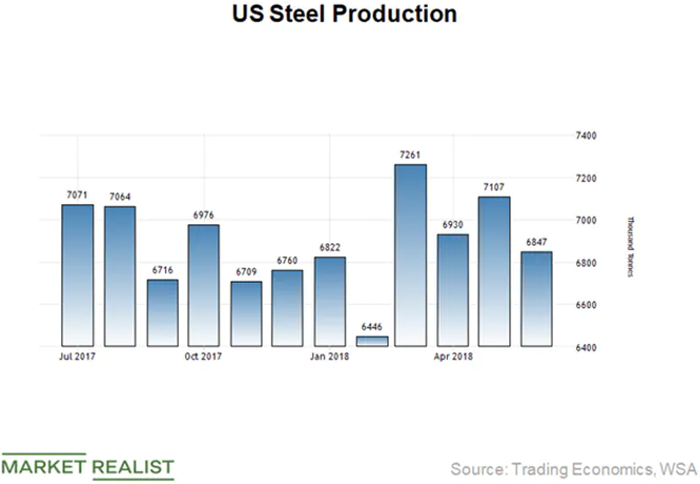
Graph 13 – Steel production in the USA - ( https://marketrealist.com/2018/11/cleveland-cliffs-to-benefit-as-us-steel-production-is-on-the-rise/ )
To sum up, U.S steel producers gain benefit after the implementation of the import tariff.
Government : the U.S government earns revenue called tariff revenue. They may reduce dependence on other countries, gain more control over their economy, especially exchange rate.
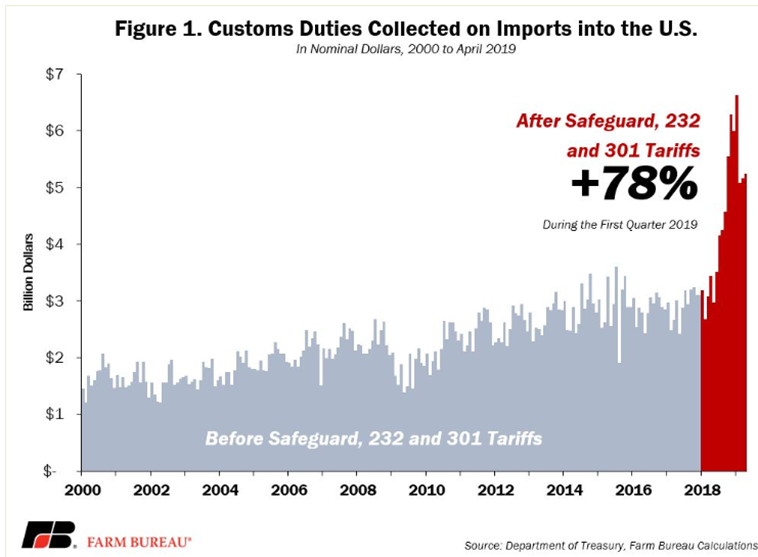
Graph 14: Customs Duties Collected on Imports into the US
However, if the US Government does not negotiate with trading partners, they may face with retaliation and trading relationship become worse, even trade war. In April 4, 2018, China retaliated and imposed 25% tariffs on soybeans, automobile, chemicals worth US$50 billion (Economictimes, 2018)
Question 3: Guest lecture reflective essay
In the guess lecture, Bob Fletcher, Director, Customs & Global Trade team of RMIT university, and joining Deloitte Vietnam, presented Free-Trade agreement such as the types, the advantages, the disadvantages, steps to determine FTA eligibility, and so on.
After class, I can relate these things with Vietnam economic situation. During time period from 1995 until now, as a member of Association of Southeast Asian Nations (ASEAN), Vietnam has signed some free trade agreements, and bilateral FTA with many countries throughout the world such as India, South Korea, New Zealand, Japan, China, and so on. Vietnam need to reduce the tariff of some kinds of goods such as automobiles (50% in 2015 to 30% in 2017), and in 2018 most of products are implemented a zero percent tariff such as vegetable oil, tropical fruits, home electronic appliances, milk, and dairy products to follow FTA agreements.
The free-trade agreement brings many benefits to Vietnam. First of all, the Vietnamese consumers may gain benefit thanks to the zero tariff policies. They have more choices, and can have more information about the goods of many different nations.
When we sign FTA with other country, we encourage and attract the foreign investors come to Vietnam (FDI), this is a way to transfer technologies as well as a knowledge spillover method. Therefore, we can improve the quality of product, and train some new, useful skills to our employees. After our industries develop and become stronger, we can export our product to foreign countries more easily because under FTA, we can submit fewer paper-based documents.
To regards Government, Vietnam can enhance the trading relationship with other countries. When we increase the export, there are more foreign people know about our country. This can improve our reputation. In addition, after foreign companies invest in Vietnam, they need to pay an amount of tax money so the Government earns more revenue. Next, Government can spend the budget on the public services such as education, healthcare, infrastructures to increase the living standard of Vietnamese people. As a small developing country, we do not have enough strength to conflict with developed countries. Therefore, when we sign the FTA, whenever we have conflict with other countries we can depend on the others countries and they may help us to solve our problems.
This class helped me a lot, in the future, in case I work for exporting or importing international company in Vietnam, I can use the knowledge that I learn from the class to know which step I need to do in paper work and which category that the products must examined before export or import.
At the end of the class, we have an interesting question about tax of the online app mobile for the guess. Then, we knew that the country cannot control the tax of the companies selling mobile applications online because they sell it directly to the customers through Internet.
References:
1. Anderson , Nelgen 2012, World Development , Trade Barrier Volatility and Agricultural Price Stabilization Volume 40, Issue 1 , January 2012, Pages 36-48, viewed 31th December 2019 < https://www-sciencedirect-com.ezproxy.lib.rmit.edu.au/science/article/pii/S0305750X11001483 >
2. Bomey, N 2018, “Tariff winners and losers: How Trump’s trade spat could affect shoppers”, USA Today, viewed 31th December 2019, < https://www.usatoday.com/story/money/2018/05/31/trump-steel-tariffs-aluminum/660403002/ >
3. Boris Begovic, Trade liberalization: the way forward, "Freedom, Commerce, and Peace: A Regional Agenda", Tbilisi, Georgia, October 25 th to 27th, 2006, Demand and supply decrease, AmosWEB Encyclonomic, viewed 31th December 2019, https://www.amosweb.com/cgi-bin/awb_nav.pl?s=wpd&c=dsp&k=demand%20and%20supply%20decrease
4. Business: Proton bomb; The car industry; The Economist; London Vol. 371, Iss. 8374, (May 8, 2004): 61. viewed 31th December 2019, < https://search-proquest-com.ezproxy.lib.rmit.edu.au/docview/224010314?OpenUrlRefId=info:xri/sid:primo&accountid=13552 >
5. Chapter 3: Leading Players and Comparative Matrix - 3.1 The Competition in National Car Manufacturing, Anonymous . EMD Reports - Malaysia; Beverly , (Second Half 2010), viewed 31th December 2019, < https://search-proquest-com.ezproxy.lib.rmit.edu.au/docview/926347532?accountid=13552&rfr_id=info%3Axri%2Fsid%3Aprimo >
6. China slaps tariffs on 106 US products; rejects Donald Trump's demand on trade deficit, viewed 31th December 2019, < https://economictimes.indiatimes.com/news/international/business/china-slaps-tariffs-on-106-us-products-rejects-donald-trumps-demand-on-trade-deficit/articleshow/63616151.cms?from=mdr >
7. Crawford, Gary W ; Lee, Gyoung-Ah , Mar 2003. “Agricultural Origins in the Korean Peninsula,” Antiquity; Cambridge, Vol. 77, Iss. 295: 87-95, viewed 27/12/2019, < https://search-proquest-com.ezproxy.lib.rmit.edu.au/docview/217581327?accountid=13552&rfr_id=info%3Axri%2Fsid%3Aprimo >
8. Graph 10: Effects of tariff on market price, viewed 31th December 2019 < https://talkmarkets.com/content/economics--politics/trade-war-thursday--trump-taxes-200bn-in-chinese-goods-25--americans-pay-him-50bn?post=185506 >
9. Graph 11 Domestic Steel prices, viewed 31th December 2019 < https://agmetalminer.com/2019/01/08/raw-steels-mmi-domestic-u-s-china-steel-prices-still-falling/ >
10. Graph 12 – Share of total U.S steel use by industry, viewed 31 th December 2019, < https://www.statista.com/statistics/752484/us-steel-demand-by-sector/ >
11. Graph 4: South Korea - Employment In Agriculture, viewed 31 th December 2019, < https://tradingeconomics.com/south-korea/employment-in-agriculture-percent-of-total-employment-wb-data.html >
12. Graph 5.1: Milled rice production in South Korea (1990-2011), viewed 31 th December 2019,
13. Graph 5: Rice Consumption in South Korea , viewed 31th December 2019 < http://nationalatlas.ngii.go.kr/pages/page_1290.php >
14. Graph 6: Price of rice in South Korea, viewed 31/12/2019,< https://www.ceicdata.com/en/korea/consumer-price-index-special-groups-2015100/cpi-commodities-am-ap-cereal-white-rice >
15. Graph 7 Proton sales from 1985-2016, viewed 31th December 2019, < http://materiaislamica.com/index.php/File:Proton_Sales_Per_Year.jpg >
16. Graph 7.1: Market share of Perodua and Proton 2001 to 2014, viewed 31 th December 2019, < http://www.kinibiz.com/story/issues/191556/perodua-pushes-proton-to-the-brink.html >
17. Graph 8: US steel imported, viewed 31th December 2019, < https://money.cnn.com/2018/03/02/news/economy/steel-industry-statistics-us-china-canada/index.html >
18. Graph 9: These are the biggest steel exporters to the US, viewed 31 th December 2019, < https://money.cnn.com/2018/03/02/news/economy/steel-industry-statistics-us-china-canada/index.html >
19. Hashimzade, Gareth, John 2017, A dictionary of Economics, Nigar Myles, and Black Edition 5, viewed 31th December 2019, https://www-oxfordreference-com.ezproxy.lib.rmit.edu.au/view/10.1093/acref/9780198759430.001.0001/acref-9780198759430
20. Jacob M. Schlesinger, Peter Nicholas and Louise Radnofsky, Trump to Impose Steep Aluminum and Steel Tariffs, Updated March 1, 2018 948 p.m, viewed 31th December 2019, < http://www.cscpails.com/wp-content/uploads/2018/03/Trump-to-Impose-Steep-Aluminum-and-Steel-Tariffs-WSJ.pdf >
21. John Newton, Ph.D. Chief Economist, 2019, Tariff Revenues Up Sharply U.S. is on Pace to Collect $72 Billion in Customs Revenue in 2019, viewed 31th December 2019, < https://www.fb.org/market-intel/tariff-revenues-up-sharply >
22. J ohnleemk on 5:25:44 am Mar 12, 2007,Malaysian Economy viewed 31th December 2019 < http://www.infernalramblings.com/articles/Malaysian_Economy/195/ >
23. Melitz, Marc J. 2005. When and how should infant industries be protected?. Journal of International Economics 66, no. 1: 177-196, viewed 31th December 2019, https://dash.harvard.edu/handle/1/3228378
24. Mohd. Rosli, Malaysia's National Automotive Policy and the Performance of Proton's Foreign and Local Vendors, PhD thesis, Univesity of Malaya, Kuala Lumpur, 2007 viewed 31th December 2019 < https://www-tandfonline-com.ezproxy.lib.rmit.edu.au/doi/full/10.1080/13602380701661044 >
25. Mohd. Rosli, The Automobile Industry and Performance of Malaysian Auto Production, Journal of Economic Cooperation 27, 1 (2006), viewed 31 th December 2019, < http://www.sesric.org/files/article/28.pdf >
26. Oryza.com, South Korea Plans to Liberalize Rice Imports in 2014 viewed 31/12/2019 < https://www.angimex.com.vn/en/2014/03/south-korea-plans-to-liberalize-rice-imports-in-2014/ >
27. Smith, N 2018, “Trump’s tariffs look like a self-inflicted wound”, Bloomberg, viewed 31th December 2019, < https://www.bloomberg.com/view/articles/2018-03-07/trump-s-tariffs-on-steel-aluminum-will-do-more-harm-than-good >
28. Table 2: Excise duty for car in Malaysia 2006, viewed 31th December 2019, < http://otoreview.blogspot.com/2008/01/guide-importing-vehicle-to-malaysia.html >
29. Wells, Peter and Michael Rawlinson,1993, Japanese Globalization And The European Automobile Industry, Cardiff Business School, University of Wales, Received January 1992; revised May 1992. Cardiff, United Kingdom, viewed 31 th December 2019, < https://onlinelibrary-wiley-com.ezproxy.lib.rmit.edu.au/doi/epdf/10.1111/j.1467-9663.1993.tb00664.x >
30. Yim, B. 2006. Korea, Republic of Grain and Feed The Changing Structure of the Korean Rice Market 2006, published date 8/11/2006, Global Agriculture Information Network report KS6088, viewed 31/12/2019, < https://apps.fas.usda.gov/gainfiles/200608/146208652.pdf >


