

Within your project, create a flowgraph model for the product data, and load the data. perform the same steps as you did for the customer data.
SAP HANA Data Modeling Case Study
Business Scenario
The company Global Bike Inc. (GBI) has acquired a new data warehouse solution based on the in-memory database SAP HANA and the corresponding SAP HANA Platform. The CIO has decided to use this solution for the sales department, as this department has to analyze huge amounts of data on a regular base. To evaluate the data modeling and reporting capabilities of the solution, a first prototype is set up using basic sales data.
You are in the role of a consultant who is specialized on data warehouse solutions. Your task is to setup this prototype. You will use SAP HANA to create a suitable data model. Furthermore you will use the Smart Data Integration Tool to populate the data model with data.
|
|
|---|---|
|
|
As indicated in the business scenario, you need to create three tables, one for sales transaction data, one for the customer master data, and one table for product master data.
Remark: You create all database tables in the database schema GBI_XXX, whereas XXX stand for your individual ID. The namespace and your individual ID will be provided by the instructor.
Logon to the SAP HANA Studio
Create a database table for the customer master data
Add following columns to the table:
| Name | Key | Data type | Length (Dim) |
|---|---|---|---|
| CUSTOMER_NUMBER | X | VARCHAR | 10 |
| CUSTOMER_NAME | VARCHAR | 20 | |
| CITY | VARCHAR | 35 | |
| VALID_TO | X | DATE | |
| VALID_FROM | DATE | ||
| SALES_ORGANIZATION | VARCHAR | 4 | |
| COUNTRY | VARCHAR | 2 |
Create the table using the Execute button.
Create a database table for the product master data
Create the table using the Execute button.
Create a database table for the sales transaction data
Use following details to create the table:
| Name | Key | Data type | Length (Dim) |
|---|---|---|---|
| YEAR | INTEGER | ||
| MONTH | INTEGER | ||
| DAY | INTEGER | ||
| CUSTOMER_NUMBER | VARCHAR | 10 | |
| ORDER_NUMBER | X | VARCHAR | 10 |
| ORDER_ITEM | X | VARCHAR | 3 |
| PRODUCT | VARCHAR | 8 | |
| SALES_QUANTITY | INTEGER | ||
| UNIT_OF_MEASURE | VARCHAR | 3 | |
| REVENUE | DECIMAL | 17,2 | |
| CURRENCY | VARCHAR | 3 | |
| DISCOUNT | DECIMAL | 17,2 |
You populate the database tables, using the Smart Data Integration Tool. For each table you create a data flow that extracts data from a flat file and that transfers this data into your database table.
Open the Modeler perspective in the SAP HANA Studio
Add a new Remote Source to the SAP HANA System
Hint: You can create Remote Sources in the Navigator View within the Provisioning tab.
Use following details to create the Remote Source:
| Source name: | RemoteSource_XXX |
|---|---|
| Adapter Name: | FileAdapter |
| Source Location: | agent(dpagent) |
| Root Directory: | /GBI_dataset |
| Directory Fileformat Def.: | /GBI_dataset |
| Credentials Mode: | Technical User |
| Access Token: | gbi |
Add virtual Data Tables to the SAP HANA System
Schema: GBI_XXX
Enter following details to import the product table:
Schema: GBI_XXX
Create a new Repository Workspace for the SAP HANA System
Hint: You can create a new Repository Workspace within the SAP HANA Development view.
Create a new Repository Package within your repository
| Repository Workspace: | Workspace_XXX |
|---|---|
| Package Name: | Package_ XXX |
Within your Repository Package, create a new Flowgraph Model
Hint: You have to open the initially empty Flowgraph Model in order to change its properties.
Within the Flowgraph Model, establish a data connection between the Virtual Table and the Data Table.
Within your Flowgraph Model, establish a data connection between the Virtual Table VT_RemoteSource_XXX_Customer.csv and the Data Table Customer_Attr_001 by defining the virtual Table as Data Source and the Data Table as Data Sink.
Execute the Flowgraph Model to load the Customer Data
Open your Flowgraph Model within the SQL editor and remove the leading dot from the Package name. Then, run the SQL command.
Check the successful execution by viewing the content of the table CUSTOMER_ATTR_XXX.
Within your project, create a Flowgraph Model for the product data, and load the data. Perform the same steps as you did for the customer data.
Within your project, create a Flowgraph Model for the sales data, and load the data. Perform the same steps as you did for the customer data.
| Flowgraph Model name: | SalesFlow |
|---|---|
| Source: | VT_Salesdata_XXX.csv |
| Target: | SALES_ATTR_XXX |
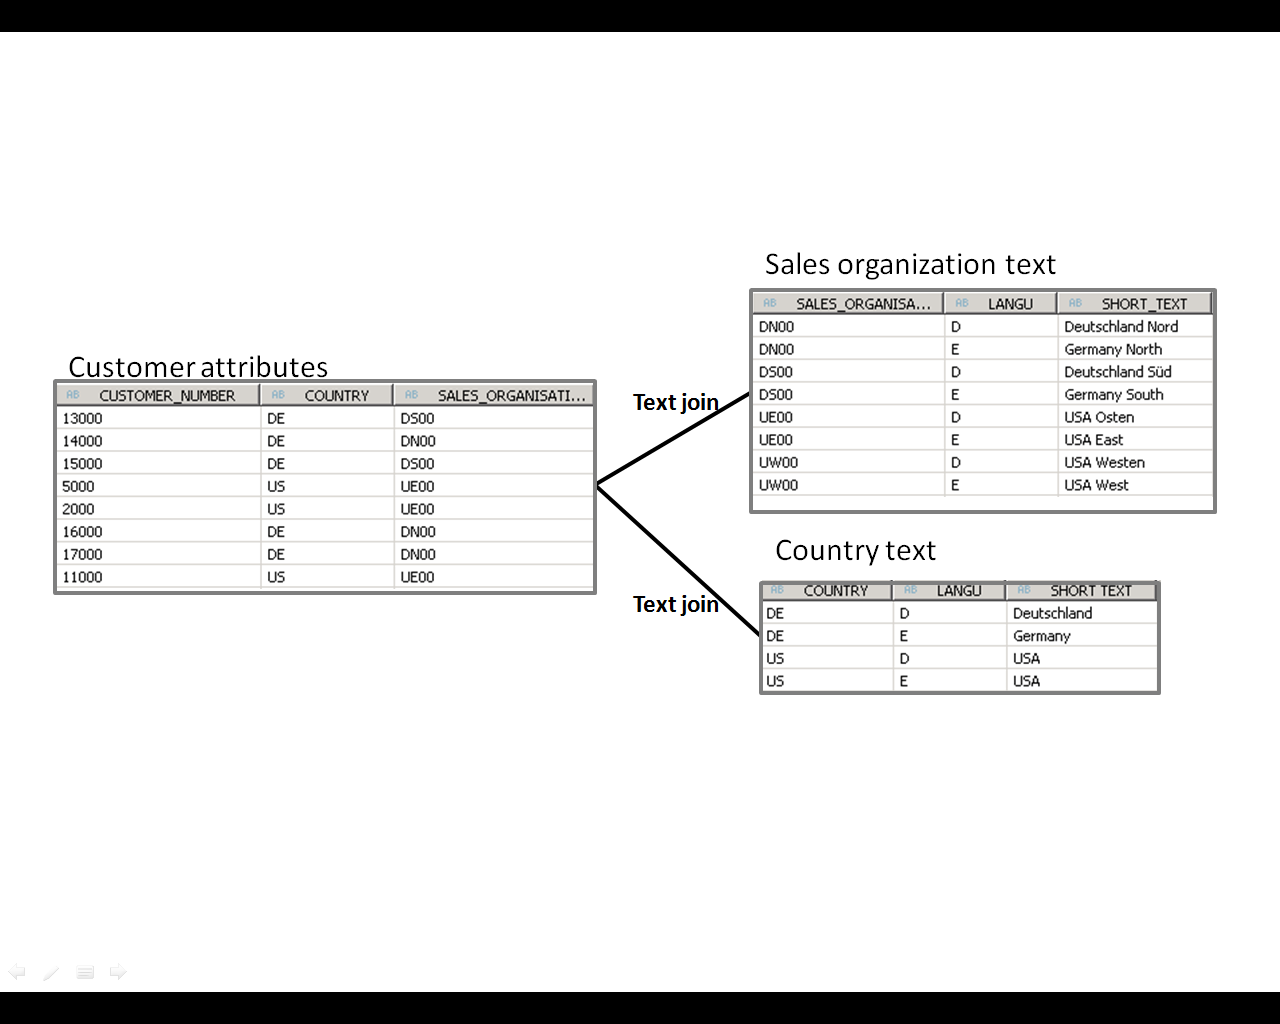
To merge this data, you have to create an Attribute View. This Attribute View joins the Customer attributes table with the text tables for country and sales organization, using a text join.
Open the Modeler perspective in the SAP HANA Studio
Create a new package to group the views that you will create in the following steps
Description: Package Student XXX
Original Language: English
In your package, create an Attribute View for the customer data
View description: Customer XXX
Tables: XX_STUDENT_XXX.CUSTOMER_ATTR_XXX,
GBI_DEMO.GBI_DEMO_COUNTRY, GBI_DEMO.GBI_DEMO_SALESORG.
Join the table GBI_DEMO_COUNTRY with table CUSTOMER_ATTR_XXX using a text join
Join the table GBI_DEMO_SALESORG with table CUSTOMER_ATTR_XXX using a text join
The view should show only current customers. For current customers, the valid-to date is equal to 9999-12-31. Add a corresponding filter to your view.
Hint: Select the VALID_TO field in the customer table and apply the filter. Please be careful that you enter the filter value in the right format (9999-12-31).
Add all attributes that should be visible in this view to the output structure
Hint: The output structure is visible on the right hand side.
| Table | Field | Key attribute |
|---|---|---|
| CUSTOMER_ATTR_XXX | CUSTOMER_NUMBER | X |
| CUSTOMER_ATTR_XXX | CUSTOMER_NAME | |
| CUSTOMER_ATTR_XXX | CITY | |
| CUSTOMER_ATTR_XXX | SALES_ORGANIZATION | |
| CUSTOMER_ATTR_XXX | COUNTRY |
Perform the description mapping for the fields COUNTRY and SALES_ORGANISATION in the properties of the output structure
Objective of the description mapping is to link a key and text fields for an attribute.
Save, validate and activate the Attribute View
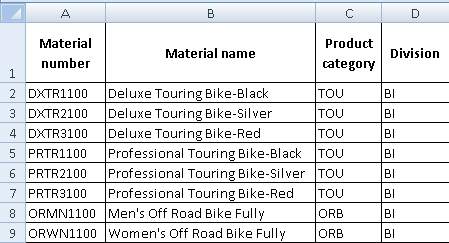
You will create an Attribute View that includes product data.
The Attribute View should show all product attributes except the price.
Create a new Attribute View for the product data in your package
Tables: PRODUCT_ATTR_XXX
Add all relevant attributes to the output structure of the Attribute View
| Table | Field | Key attribute |
|---|---|---|
| PRODUCT_ATTR_XXX | PRODUCT | X |
| PRODUCT_ATTR_XXX | PRODUCT_NAME | |
| PRODUCT_ATTR_XXX | PRODUCT_CATEGORY | |
| PRODUCT_ATTR_XXX | DIVISION | |
| PRODUCT_ATTR_XXX | COLOR | |
| PRODUCT_ATTR_XXX | PRODUCT_GROUP | |
| PRODUCT_ATTR_XXX | INTERNAL_PRICE |
Save, validate and activate your Attribute View
You want to analyze the sales data by customer and product.
Create a new Analytic View for the sales data in your package
View name: SALES_AV_XXX
View description: Sales XXX
| Table | Field | Type |
|---|---|---|
| SALES_XXX | YEAR | attribute |
| SALES_XXX | MONTH | attribute |
| SALES_XXX | CUSTOMER_NUMBER | attribute |
| SALES_XXX | PRODUCT | attribute |
| SALES_XXX | UNIT_OF_MEASURE | attribute |
| SALES_XXX | CURRENCY | attribute |
| SALES_XXX | SALES_QUANTITY | measure |
| SALES_XXX | REVENUE | measure |
| SALES_XXX | DISCOUNT | measure |
Join the sales table with the product and customer view, using a referential join
Hint: To join tables, you have to switch to the Star Join component.
Join DataFoundation.PRODUCT with PRODUCT_ATV_XXX.PRODUCT.
Add the net sales price as calculated measure to the output structure of your view
Formula: Revenue – Discount.
Regarding the currency, enter following details:
Save, validate and activate the Analytic View
Open the data preview for your Analytic View and check the data
Open SAP Lumira and login with your Credentials
Start Lumira by calling the link provided by your instructor.
Select your Analytic View as basis for your analysis
Analyze the data provided by your Analytic View
What are the top 3 products by revenue sold in Germany in May 2011?
Hint: You have to define the Revenue as Measure variable.


