

What could explain the low population growth rate over

Lionfish Invasion:
PART 1: Introduction to Lionfish
Open the Lionfish InvasionClick & Learn and go through the “Introduction” tab, which discusses lionfish as an invasive species.
| 1. |
|---|
| 2. |
|---|
Open the “Models” tab and go through the “Lionfish estimates” section, which discusses how biologists estimate the size of lionfish populations.
| 3. |
|
|---|
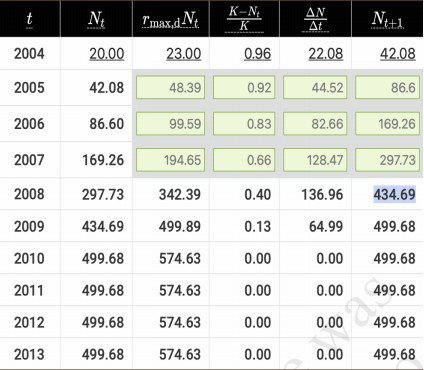
● You only need to do calculations for 2005, 2006, and 2007. Once you have completed these rows, the rest of the table will be filled in automatically.
● You can click on each term at the top of the table to learn more about it. You can also click on each number in the first row to see how that number was calculated.
| t | Nt | rmax,dNt | (K – Nt)/K | ΔN/Δt | Nt+1 |
|---|---|---|---|---|---|
| 2004 | 20 | 23 | 0.96 | 22.08 | 42.08 |
| 2005 | 42.08 | 48.39 | 0.92 | 44.52 | 86.6 |
| 2006 | 86.60 | 99.59 | 0.83 | 82.66 | 169.26 |
Go through the “Revising the model” section, which explains the differences between the discrete-time and continuous-time logistic
|
|---|
PART 3: Exploring Growth Rates
Go through the rest of the “Visualizing the model” section, then continue to the “Changing rates” section. Read through the first part
of the section, stopping when you reach the graph.
|
|---|
a. What is the approximate carrying capacity for this population? The carrying capacity is around 500 lionfish per 10,000 m2 b. At what population size (N) is the overall population growth rate (dN/dt) the highest? 238.00
c. How does your answer to Part B compare to the carrying capacity? It's completely different, and I was taken aback by it.
Answer the questions at the end of the “Changing rates” section. You can answer them in the Click & Learn or mark your answers below.
|
|
|
|
|
|
14. At lower densities, paprika pepper plants produce a higher total weight of fruit. In this case, the main factor that limits population growth is:
d. social behavior
15. Protozoa at higher densities have lower population growth rates, especially when less food is available. In this case, the main factor that limits population growth is:
|
16. Fish at high densities have more sea lice, which can injure or kill the fish. In this case, the main factor that limits population growth is:
d. social behavior
18. As the density of mosquito larvae increases, more mosquito larvae are eaten by fish. In this case, the main factor that limits population growth is:
|
20. Think about the factor you chose in the previous question. Describe what could stop that factor from limiting the lionfish population in the future.
|
|---|
22. What is currently being done to control this invasive species and its impacts?


