

What amounts did bill san antonio dominion and amsterdam enterprises for may
CHAPTER 5
ACTIVITY-BASED COSTING AND ACTIVITY-BASED MANAGEMENT5-1 Broad averaging (or “peanut-butter costing”)describes a costing approach that uses broad averages for assigning (or spreading, as in spreading peanut butter) the cost of resources uniformly to cost objects when the individual products or services, in fact, use those resources in non-uniform ways.
Three guidelines for refinement are
1. Classify as many of the total costs as direct costs as is economically feasible.2. Expand the number of indirect cost pools until each of these pools is more homogenous.
(iii) Product-sustaining costs or service-sustaining costs: costs of activities undertaken to support individual products or services regardless of the number of units or batches in which the units are produced.
(iv) Facility-sustaining costs: costs of activities that cannot be traced to individual products or services but support the organization as a whole.
5-8 Four decisions for which ABC information is useful are 1. pricing and product mix decisions,
2. cost reduction and process improvement decisions, 3. product design decisions, and
4. decisions for planning and managing activities.5-9 No. Department indirect-cost rates are similar to activity-cost rates if (1) a single activity accounts for a sizable fraction of the department’s costs, or (2) significant costs are incurred on different activities within a department but each activity has the same cost-allocation base, or (3) significant costs are incurred on different activities with different cost-allocation bases within a department but different products use resources from the different activity areas in the same proportions.
5-12 No, ABC systems apply equally well to service companies such as banks, railroads, hospitals, and accounting firms, as well merchandising companies such as retailers and
5-2
516 (20 min.) Cost hierarchy.
Forrester, Inc., manufactures karaoke machines for several well-known companies. The machines differ significantly in their complexity and their manufacturing batch sizes. The following costs were incurred in 2014:
Forrester needs the same number of machine-hours to make each type of karaoke machine and that Forrester allocates all overhead costs using machine-hours as the only allocation base. How, if at all, would the machines be miscosted? Briefly explain why.
3. How is the cost hierarchy helpful to Forrester in managing its business?
d. Setup costs of $365,000 are batch-level costs because they relate to a group of units of product produced after the machines are set up.
e. Costs of designing processes, drawing process charts, and making engineering changes for individual products, $287,500, are product sustaining because they relate to the costs of activities undertaken to support individual products regardless of the number of units or batches in which the product is produced.
Forrester can use this information to manage its business in several ways:
a. Pricing and product mix decisions. Knowing the resources needed to manufacture and sell different types of karaoke machines can help Forrester to price the different karaoke machines and also identify which karaoke machines are more profitable. It can then emphasize its more profitable products.b. Forrester can use information about the costs of different activities to improve processes and reduce costs of the different activities. Forrester could have a target of
5-17 (25 min.) ABC, cost hierarchy, service.
(CMA, adapted) Vineyard Test Laboratories does heat testing (HT) and stress testing (ST) on materials and operates at capacity. Under its current simple costing system, Vineyard aggregates all operating costs of $1,190,000 into a single overhead cost pool. Vineyard calculates a rate per test-hour of $17 ($1,190,000, 70,000 total test-hours). HT uses 40,000 test-hours, and ST uses 30,000 test-hours. Gary Celeste, Vineyard’s controller, believes that there is enough variation in test procedures and cost structures to establish separate costing and billing rates for HT and ST. The market for test services is becoming competitive. Without this information, any miscosting and mispricing of its services could cause Vineyard to lose business. Celeste divides Vineyard’s costs into four activity-cost categories.
2. Calculate the cost per test-hour for HT and ST. Explain briefly the reasons why these numbers differ from the $17 per test-hour that Vineyard calculated using its simple costing system.
3. Explain the accuracy of the product costs calculated using the simple costing system and the ABC system. How might Vineyard’s management use the cost hierarchy and ABC information to better manage its business?
Service-sustaining costs
d. Costs of designing tests, $264,000.These costs are service-sustaining costs because they are incurred to design the HT and ST tests, regardless of the number of batches tested or the number of hours of test time.
|
|
|||
|
||||
|
$100,000 | $ 2.50 | $ 1.53 | |
| 200,000 | 5.00 | 150,000 | 5.00 | |
|
340,000 | 8.50 | 90,000 | 3.00 |
|
||||
| $25 per setuphour† 3,600 setuphours | ||||
| 180,000 | 4.50 | 84,000 | 2 .80 | |
| $820,000 | $20 .50 | $370,000 | $12 .33 | |
*$350,000 (40,000 + 30,000) hours = $5 per test-hour
†$430,000 (13,600 + 3,600) setup hours = $25 per setup-hour
**$264,000 (3,000 + 1,400) hours = $60 per hourAt a cost per test-hour of $17, the simple costing system undercosts heat testing ($20.50) and overcosts stress testing ($12.33). The reason is that heat testing uses direct labor, setup, and design resources per hour more intensively than stress testing. Heat tests are more complex, take longer to set up, and are more difficult to design. The simple costing system assumes that testing costs per hour are the same for heat testing and stress testing.
5-18 (15 min.) Alternative allocation bases for a professional services firm.
The Walliston Group (WG) provides tax advice to multinational firms. WG charges clients for (a) direct professional time (at an hourly rate) and (b) support services (at 30% of the direct professional costs billed). The three professionals in WG and their rates per professional hour are as follows:
2. Suppose support services were billed at $75 per professional labor-hour (instead of 30% of professional labor costs). How would this change affect the amounts WG billed to the two clients for May 2014? Comment on the differences between the amounts billed in requirements 1 and 2.
3. How would you determine whether professional labor costs or professional labor-hours is the more appropriate allocation base for WG’s support services?
| $640 | 26 | $16,640 | 30% | $21,632 | ||
|---|---|---|---|---|---|---|
| 220 | 5 | 1,100 | 30 | 330 | 1,430 | |
|
100 | 39 | 3,900 | 30 | 1,170 | 5,070 |
$28,132 AMSTERDAM
ENTERPRISES
$14,092
2.
|
||||||
|
||||||
|
Hour |
|
||||
| (3) | (4) = (2) (3) (5) |
|
||||
SAN ANTONIO
DOMINION
$26,890 AMSTERDAM
ENTERPRISES
| $640 | 4 | $75 | $ 2,860 | |||
|---|---|---|---|---|---|---|
| 220 | 14 | 3,080 | 75 | 1,050 | 4,130 | |
|
100 | 52 | 5,200 | 75 | 3,900 | 9,100 |
$16,090
5-8
5-19 (20 min.) Plantwide, department, and ABC indirect cost rates.
Automotive Products (AP) designs and produces automotive parts. In 2014, actual variable manufacturing overhead is $308,600. AP’s simple costing system allocates variable manufacturing overhead to its three customers based on machine-hours and prices its contracts based on full costs. One of its customers has regularly complained of being charged noncompetitive prices, so AP’s controller Devon Smith realizes that it is time to examine the consumption of overhead resources more closely. He knows that there are three main departments that consume overhead resources: design, production, and engineering. Interviews with the department personnel and examination of time records yield the following detailed information.
3. Comment on your answers in requirements 1 and 2. Which customer do you think was complaining about being overcharged in the simple system? If the new department-based rates are used to price contracts, which customer(s) will be unhappy? How would you respond to these concerns?
4. How else might AP use the information available from its department-by-department analysis of manufacturing overhead costs?
Actual plantwide variable
MOH rate based on machine hours, $308,6004,000
| United | Holden |
|---|
|
$9,258 |
|
$83,322 | $308,600 |
|---|
5-10
| United | Holden | |
|---|---|---|
| Motors | Motors |
b. Plantwide rate
| (Requirement 1) | $ 9,258 | $216,020 | |
|---|---|---|---|
| Ratio of (a) ÷ (b) | 2.57 | 0.89 | 1.10 |
The United Motors contract uses only 3% of total machines hours in 2011, yet uses 28% of CAD design-hours and 19% of engineering hours. The result is that the plantwide rate, based on machine hours, will greatly underestimate the cost of resources used on the United Motors contract. This explains the 157% increase in indirect costs assigned to the United Motors contract when department rates are used. The Leland Auto contract also uses far fewer machine-hours than engineering-hours and is also undercosted.
In contrast, the Holden Motors contract uses less of design (51%) and engineering (16%) than of machine-hours (70%). Hence, the use of department rates will report lower indirect costs for Holden Motors than does a plantwide rate.
5. It would not be worthwhile to further refine the cost system into an ABC system if (1) a single activity accounts for a sizable proportion of the department’s costs or (2) significant costs are incurred on different activities within a department, but each activity has the same cost driver or (3) there wasn’t much variation among contracts in the consumption of activities within a department. If, for example, most activities within the design department were, in fact, driven by CAD-design hours, then the more refined system would be more costly and no more accurate than the department-based cost system. Even if there was sufficient variation, considering the relative sizes of the three department cost pools, it may only be cost-effective to further analyze the engineering cost pool, which consumes 78% ($240,000$308,600) of the manufacturing overhead.
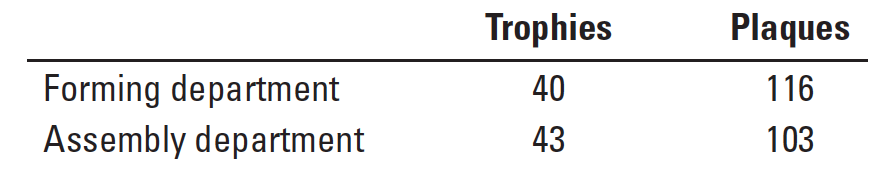
5-20 (50 min.) Plantwide, department, and activity-cost rates.
5-12
4. Explain how the disaggregation of information could improve or reduce decision quality.
SOLUTION
| Trophies | Plaques |
|---|
|
31,200 | 18,000 |
|
||||||||||
|---|---|---|---|---|---|---|---|---|---|---|---|---|---|
| 15,600 | 21,000 | ||||||||||||
| 46,800 | 39,000 | ||||||||||||
| $78,000 | $80,250 | ||||||||||||
| Budgeted overhead rate= |
($24,000 | | $20,772 | | $46,000 | | $21,920) | | $112,692 | $0.712114 | |||
| $158,250 | = | per dollar of direct cost | |||||||||||
| Trophies | Plaques |
|
|||||||||||
|
|||||||||||||
| 46,800 | 39,000 |
|
|||||||||||
|
78,000 | 80,250 | |||||||||||
| Allocated overhead* | 55,544 | 57,148 | |||||||||||
|
|
||||||||||||
|
28,392 | 16,380 | 44,772 |
|---|---|---|---|
|
23,332 | 44,588 | 67,920 |
| $129,724 | $141,218 | $270,942 | |
| Trophies |
Allocated overhead
| $28,392 | $16,380 | $44,772 |
|---|
Allocated overhead
| $11,666 | $22,294 | $33,960 |
|---|
$24,000
Budgeted setup rate =156 batches= $153.84615 per batchBudgeted supervision rate = $20,772 $49,200 = $0.422195 per direct-labor dollar
| 6,154 | 17,846 | 24,000 | |
|---|---|---|---|
|
|||
|
13,172 | 7,600 | 20,772 |
5-21 (10–15 min.) ABC, process costing.
Parker Company produces mathematical and financial calculators and operates at capacity. Data related to the two products are presented here:
2. Compute the manufacturing cost per unit for each product.
3. How might Parker’s managers use the new cost information from its activity-based costing system to better manage its business?
| Rate | |||
|---|---|---|---|
|
|
||
| Machine-hours | |||
= $1,200 per production run
| Inspection |
|---|
| Mathematical | Financial |
|---|
Manufacturing cost per unit:
Direct materials
|
|||
|---|---|---|---|
|
1.00 | ||
|
|
||
5-17
overhead costs to its jobs based on number of jobs. There were three jobs in 2014. One customer, Sanders, has complained that the cost of its building in Chicago was not competitive. As a result, the controller has initiated a detailed review of the overhead allocation to determine if overhead costs are charged to jobs in proportion to consumption of overhead resources by jobs. She gathers the following information.
SOLUTION
Note: The cost driver for engineering is number of engineering-hours, not number of engineers. This change does not, however, affect the solution itself.
| Engineering dept. hours | $500,030 ÷ (2,000 + 2,000 + 2,200) |
|---|
= $80.65 per engineering-hour
Overhead cost allocated to each project using department overhead cost rates:
| Sanders | Hanley | Stanley | |
|---|---|---|---|
|
$ 750,000 | ||
| Engineering: $80.65 × 2,000; 2,000; 2,200 | 161,300 | 161,300 | 177,430 |
| Construction: $32.50 × 20,800; 21,500; 19,600 676,000 | 698,750 | 637,000 | |
| $1,610,050 |
|
||
3.
| (Requirement 2) | $ 987,300 | $1,610,050 |
|---|
The overhead allocated to Sanders decreases by 26% under the department rates, the overhead allocated to Hanley increases by about 20%, and the overhead allocated to Stanley increases by about 6%.
| Department |
|
|
||
|---|---|---|---|---|
| 10% | 50% | 40% | ||
|
32 | 32 | 36 | |
| Construction |
|
33 | 35 | 32 |
consumption of design resources, if possible, and show willingness to partner with them to do so. CKM could even offer to phase in the new prices.
4. It would not be worthwhile to further refine the cost system into an ABC system if (1) a single activity accounts for a sizable proportion of the department’s costs or (2) significant costs are incurred on different activities within a department, but each activity has the same cost driver or (3) there wasn’t much variation among contracts in the consumption of activities within a department. If, for example, most activities within the design department were, in fact, driven by design-hours, then the more refined system would be more costly and no more accurate than the department-based cost system.


