Using the invoice table structure shown table
Chapter 6 Normalization of Database Tables
Chapter 6
Table structures are poor whenever they promote uncontrolled data redundancy. For example, the table structure shown in Figure IM6.1 is poor because it stores redundant data. In this example, the AC_MODEL, AC_RENT_CHG, and AC_SEATS attributes are redundant. (For example, note that the hourly rental charge of $58.50 is stored four times, once for each of the four Cessna C172 Skyhawk aircraft – check records 1, 2, 4, and 9.)
Figure IM6.1 A Poor Table Structure
Chapter 6 Normalization of Database Tables
originally stored in the AIRCRAFT_1 table, these two tables can be connected through the AIRCRAFT table's foreign key, MOD_CODE.
Note that – after the revision a rental rate change need be made in only one place and the number of seats for each model is given in only one place. No more data update and delete anomalies and no more data integrity problems. The relational diagram in Figure IM6.4 shows how the two tables are related.
Figure IM6.4 The Relational Diagram
Normalization provides an organized way of determining a table's structural status. Better yet, normalization principles and procedures provide a set of simple techniques through which we can achieve the desired and definable structural results.
Without normalization principles and procedures, we lack evaluation standards and must rely on experience (and yes, some intuition) to minimize the probability of generating data integrity problems. The problem with relying on experience is that we usually learn from experience by making errors. While we're learning, who and what will be hurt by the errors we make?
|
|---|
186
Normalization does not eliminate data redundancy; instead, it produces the carefully controlled redundancy that lets us properly link database tables.
2. When is a table in 1NF?
A table is in 3NF when it is in 2NF and it contains no transitive dependencies.
5. When is a table in BCNF?
187
| C1 | C2 | C3 | C4 |
|---|
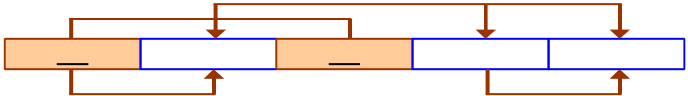
a. Identify and discuss each of the indicated dependencies.
C1 C2 represents a partial dependency, because C2 depends only on C1, rather than on the entire primary key composed of C1 and C3.
The normalization results are shown in Figure Q6.6b.
Figure Q6.6b The Dependency Diagram for Question 6b
| C1 | C3 | C4 | C5 | |
|---|---|---|---|---|
|
Normal form: 2NF, because the
Chapter 6 Normalization of Database Tables
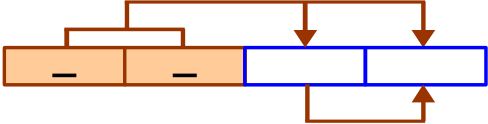
c. Create a database whose tables are at least in 3NF, showing the dependency diagrams for each table.
Normal form: 3NF
| C1 | C3 | C4 | |
|---|---|---|---|
| C4 (to Table 3) |
189
Chapter 6 Normalization of Database Tables
The normalization results are shown in Figure Q6.7a.
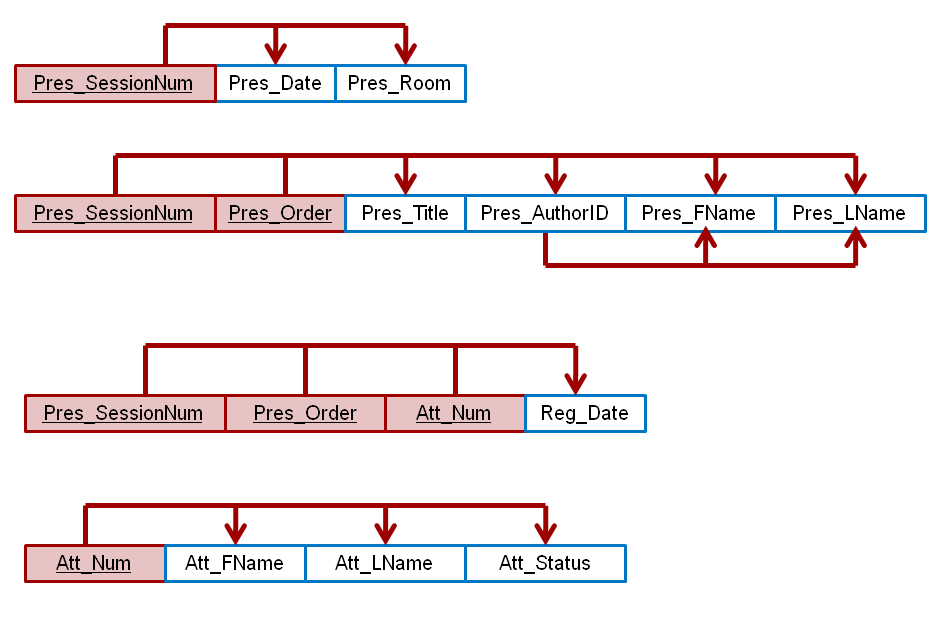
Figure Q6.7b The 3NF normalization results for Question 7b.
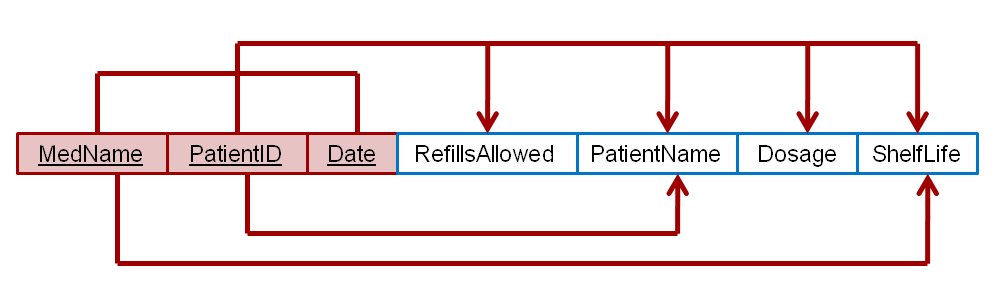
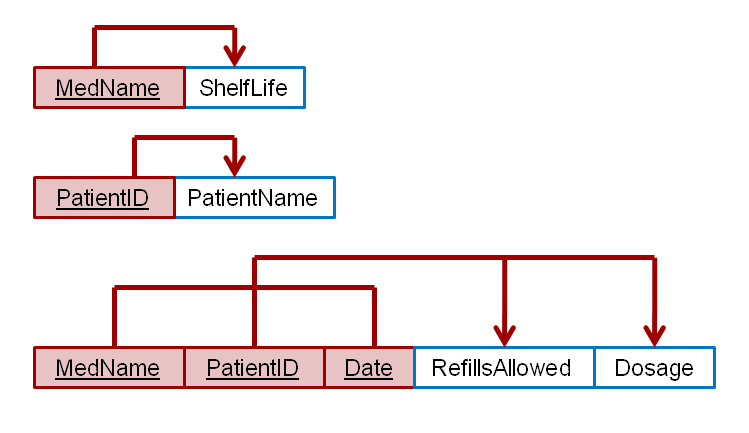
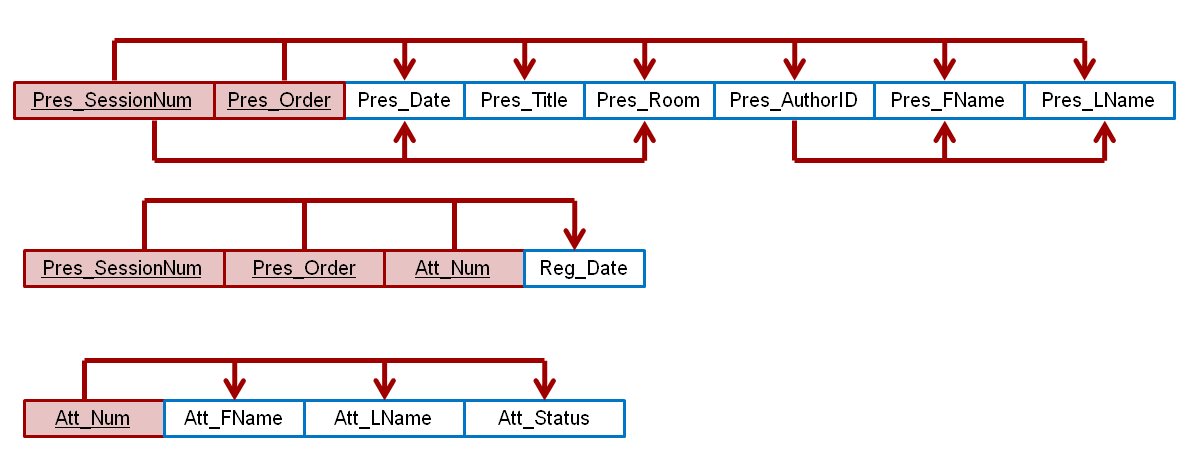
Figure Q6.8 Prescription dependency diagram
9. What is a partial dependency? With what normal form is it associated?
Chapter 6 Normalization of Database Tables
Make sure that the new table's primary key attribute is the foreign key in the original table.
Figure Q6.9 shows an example of a transitive dependency removal.
| INV_NUM | INV_AMOUNT | CUS_NUM | CUS_ADDRESS |
|---|
Transitive Dependencies
| CUS_NUM |
|---|
12. What is a surrogate key, and when should you use one?
A surrogate key is an artificial PK introduced by the designer with the purpose of simplifying the assignment of primary keys to tables. Surrogate keys are usually numeric, they are often automatically generated by the DBMS, they are free of semantic content (they have no special meaning), and they are usually hidden from the end users.
14. How would you describe a condition in which one attribute is dependent on another attribute when neither attribute is part of the primary key?
This condition is known as a transitive dependency. A transitive dependency is a dependency of one nonprime attribute on another nonprime attribute. (The problem with transitive dependencies is that they still yield data anomalies.)
If the student’s Social Security number had been included as one of the attributes in the STUDENT table—perhaps named STU_SOCSECNUM—both it and STU_NUM would have been candidate keys because either one would uniquely identify each student. In that case, the selection of STU_NUM as the primary key would be driven by the designer’s choice or by enduser requirements. Note, incidentally, that a primary key is a superkey as well as a candidate key.
16. A table is in ___3rd___ normal form when it is in ___2nd normal form___ and there are no transitive dependencies.
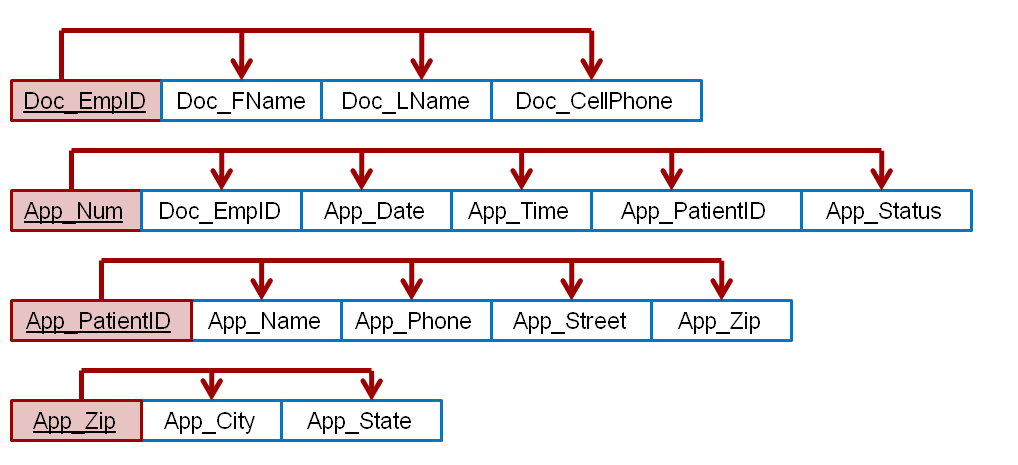
1. Using the descriptions of the attributes given in the figure, convert the ERD shown in Figure P6.1 into a dependency diagram that is in at least 3NF.
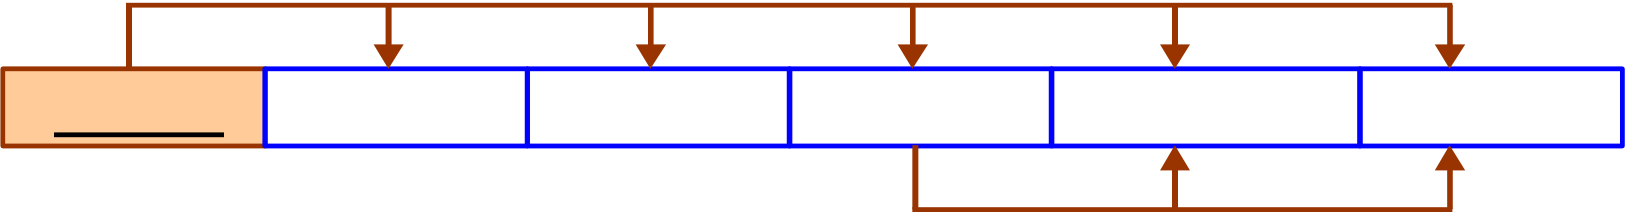
An initial dependency diagram depicting only the primary key dependencies is shown in Figure P6.1a below.
As discussed in the chapter, ZIP_Codes can be used to determine a city and state; therefore, we also have the transitive dependency:
App_Zip App_City, App_StateFigure P6.1b depicts the dependency diagram with these transitive dependencies included.
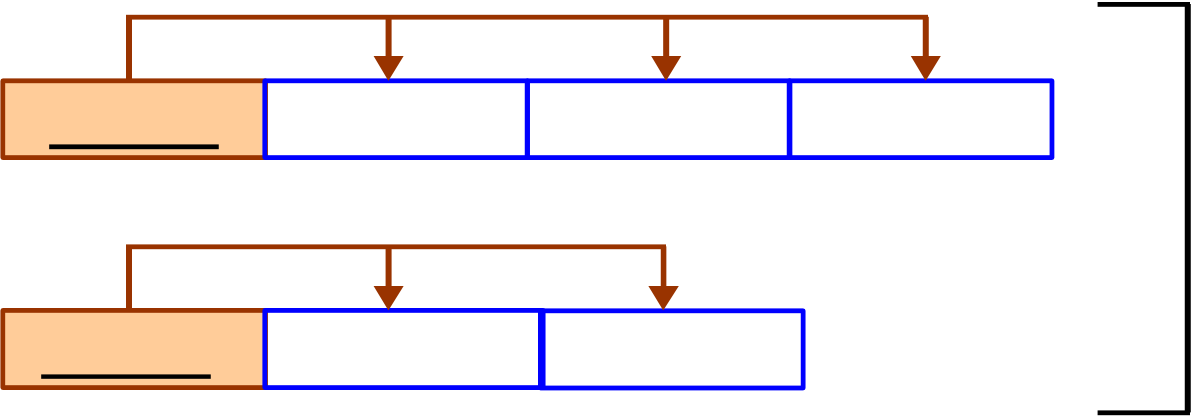
Since the first transitive dependency completely encloses the second transitive dependency, it is appropriate to resolve the first transitive dependency before resolving the second. Figure P6.1c shows the results of resolving the first transitive dependency.
Figure P6.1c Resolving the first transitive dependency
Chapter 6 Normalization of Database Tables
197
Chapter 6 Normalization of Database Tables
Figure P6.2b Revised dependency diagram for Problem 2
Finally, the transitive dependency is resolved to achieve the 3NF solution shown in the final dependency diagram in Figure P6.2d.
200
Chapter 6 Normalization of Database Tables
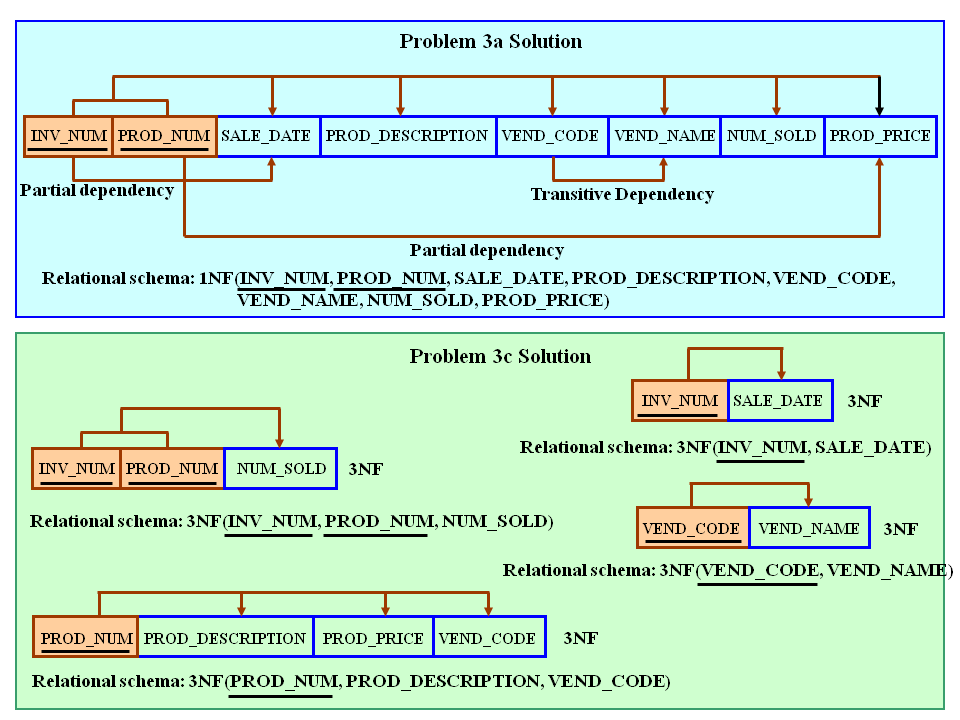
a. Write the relational schema, draw its dependency diagram and identify all dependencies, including all partial and transitive dependencies. You can assume that the table does not contain repeating groups and that any invoice number may reference more than one product. (Hint: This table uses a composite primary key.)
The solutions to both problems (3a and 3b) are shown in Figure P6.3a.
Chapter 6 Normalization of Database Tables
Figure P6.3a The Dependency Diagrams for Problems 3a and 3b
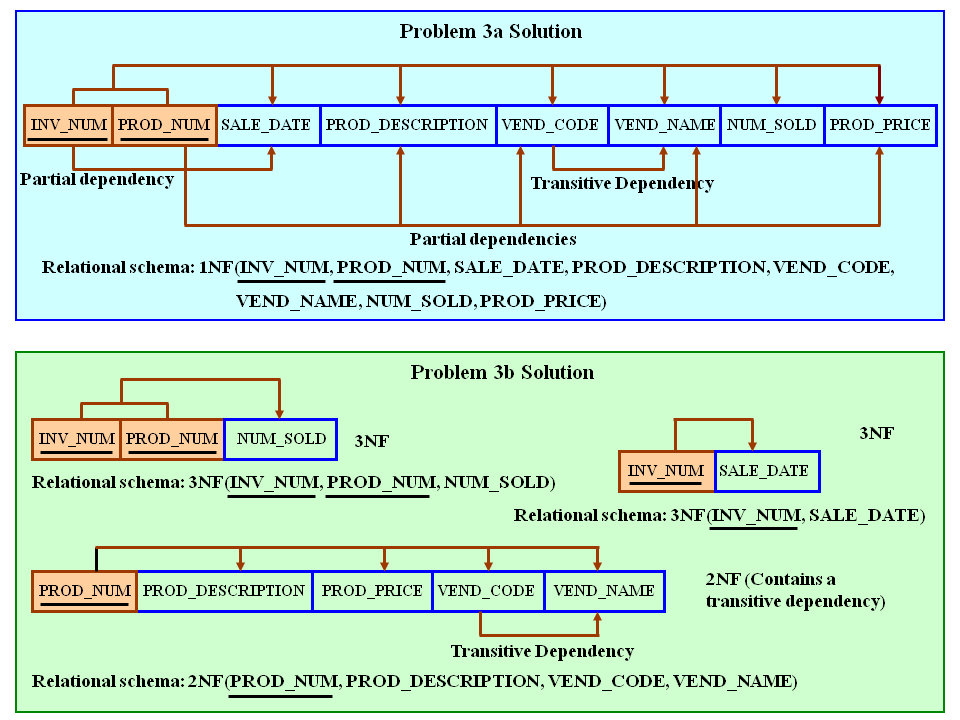
Figure P6.3c The Dependency Diagram for Problem 3c