

Use the pivot method the dataframe matplotlib pltsex train sex
COMP3160: Artificial Intelligence A ML Project: Titanic Competition
Rolf Schwitter
The Titanic Competition
• The Titanic ML competition is a competition that runs on the Kaggle platform: https://www.kaggle.com/c/titanic
Note: The subsequent code is taken from the Kaggle website and has been adapted for COMP3160.
|
3 |
|---|
# (891, 12)
# (418, 11)
# Pclass: 1 = first class; 2 = second class; 3 = third class.
# SibSp: number of siblings and spouses travelling with the passenger. # Parch: number of parents and children travelling with the passenger. # Ticket: the passenger’s ticket number.
| 5 |
|---|
test.head(6)

|
7 |
|---|
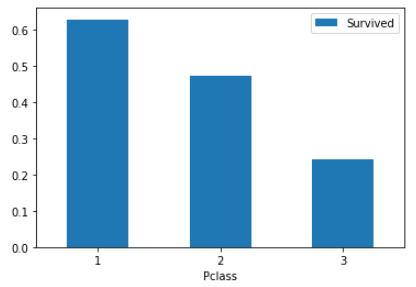
sex_pivot = train.pivot_table(index = "Sex", values = "Survived") sex_pivot.plot.bar()
plt.xticks(rotation = 0)
class_pivot = train.pivot_table(index = "Pclass", values = "Survived") class_pivot.plot.bar()
plt.xticks(rotation = 0)
plt.show()
| 9 |
|---|
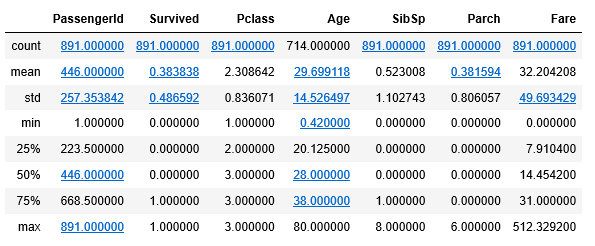
count 714.000000
mean 29.699118
std 14.526497
min 0.420000
25% 20.125000
50% 28.000000
75% 38.000000
max 80.000000
Name: Age, dtype: float64
survived = train[train["Survived"] == 1]
died = train[train["Survived"] == 0]survived["Age"].plot.hist(alpha = 0.5, color = 'red', bins = 50) died["Age"].plot.hist(alpha = 0.5, color = 'blue', bins = 50) plt.legend(['Survived', 'Died'])
plt.show()
| 11 |
|---|
# In order to be useful for our ML model, we can separate this
# continuous feature into a categorial one by dividing it into ranges.
|
13 |
|---|
Bin Values Into Discrete Intervals
# We use one more cut point than label names to account for # the upper bound of the last segment.
cut_points = [-1, 0, 5, 12, 18, 35, 60, 100]
label_names = ["Missing", "Infant", "Child", \
"Teenager", "Young Adult", "Adult", "Senior"]© Macquarie University 2021 15
Output: Bar Chart
| 16 |
|---|
Preparing the Data for ML
# 3 491
# 1 216
# 2 184
# Name: Pclass, dtype: int64
|
18 |
|---|
Preparing the Data for ML
| 20 |
|---|


