
Then plot these ucl and the lcl and our sample points
Contents
INTRODUCTION & PROBLEM DESCRIPTION 4
EXECUTIVE SUMMARY
to get an information about the working of the above processes and to check whether any kind of improvement/ adjustment is needed or not.
INTRODUCTION & PROBLEM DESCRIPTION
Before starting manufacture of an entire lot or batch of components (or products), two conditions must be satisfied to reduce the proportion of defectives and external failure costs:
For accomplishing the above task, samples are taken from each of these processes: For process A, the no. of flaws on each roll of wallpaper was calculated and analyzed, and for process B, the weights of the output were measured.
The data obtained are as follows:
Now, a quality control study has been performed on this data with the use of control charts (X-bar chart, R chart and c chart).
METHODOLGY & RESULTS
PROCESS A
Methodology
In process A, we have to study the number of defects on a single sheet. The incidence of defects has been modeled using the Poisson distribution. Here the quality of a component is measured in terms of the number of defects per component so a c chart has been used.
Results
c-chart
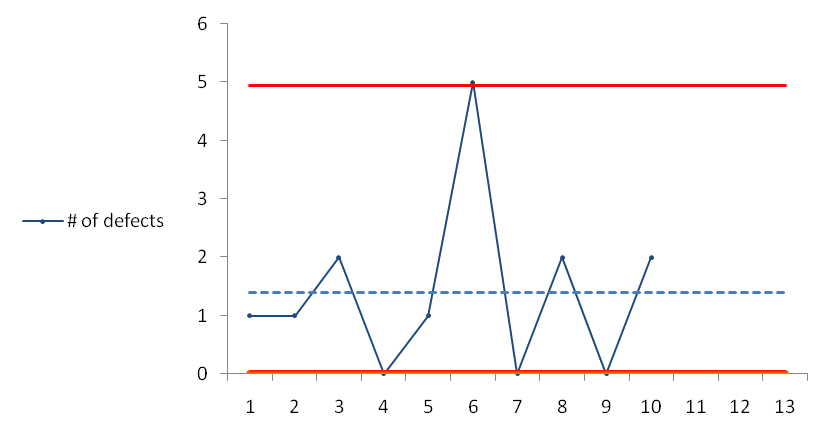
So, we see that one of the points in our sample lies above the UCL. So, the conclusion is that the process is out of control.
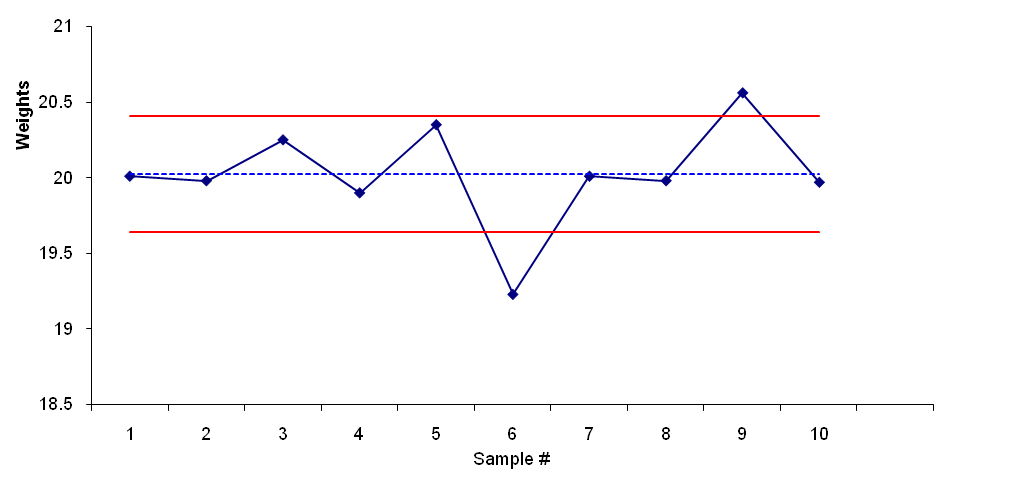
Process B
Methodology
Results
| Control Limits for R Chart | ||||
|---|---|---|---|---|
| CLR | 0.524 | |||
| UCLR | 1.196 | |||
| LCLR | 0.000 | |||
X-bar Chart
R-Chart
DISCUSSION AND RECOMMENDATION
Process A
Process B
CONCLUSION
REFERENCES
Jeya Chandra, M., 2001. Statistical Quality Control. USA: CRS Press
Montgomery, Douglas C., 2008. Introduction to Statistical Quality Control. 6th ed. John Wiley & Sons


