

The value the range equal six times the value standard deviation
lOMoARcPSD|2813415
TASK 2
|
50 |
Bar Graph of Building Types
|
|---|
Total 14.00% |
|---|
A. According to my sample, there are 18 brick buildings in the properties.
B. Brick and Brick veneer most frequently occur in my sample.
1 112
2 152
7 305
8 315
13 361
14 385
ii.The first and third quartiles.
Q1= [(n+1)25/100]th position
Q1= [49*25/100]th position
Q1=12.25th position
Therefore, Q1 lies in the 12.25 position.
lOMoARcPSD|2813415
TASK 4
Sold Price
C. i. Ans: An appropriate central tendency will be median or mode due to extreme values. Ans: An appropriate measure of dispersion from the sold price data will be inter-quartile ii.
range due to presence of extreme values.
If the value of the range is equal to six times the value of standard deviation, then the
data is said to be normally distributed.
b.Ans:
P(–a < Z < b)
∴ P(–1.5< Z < 1.5) = Φ(1.5) – {1 – Φ(1.5)} = 0.9332-0.668 = 0.8664
C.
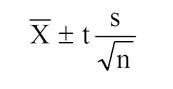
Lower limit = mean –z (standard deviation/n)
= 621.67-1.5(452.91/47)
Standard
|
|---|
The confidence interval is 0.90. Therefore, the lower bound of the confidence interval is 487.3 and the upper bound of the confidence interval is 756.04. It is 90% confidence that it will lie between the interval of 487.3 to 756.04.
B. Ans: No, we have to make new intervals as it wouldn’t lie as the interval is 487.3 to 756.04. According to the formula interval is generated with the mean so if mean changes the interval changes as well.
|
|---|
Confidence Level (99%) = 0.18
95% of confidence interval =Mean+/- 1.96*SE
=0.76 +/- 1.96*0.06
Upper limit =0.87
Lower limit=0.64
The confidence interval is 0.95. Therefore, the lower bound of the confidence interval is 0.64 and the upper bound of the confidence interval is 0.87. It is 95% confidence that lie between the intervals of 0.64 to 0.87.


