
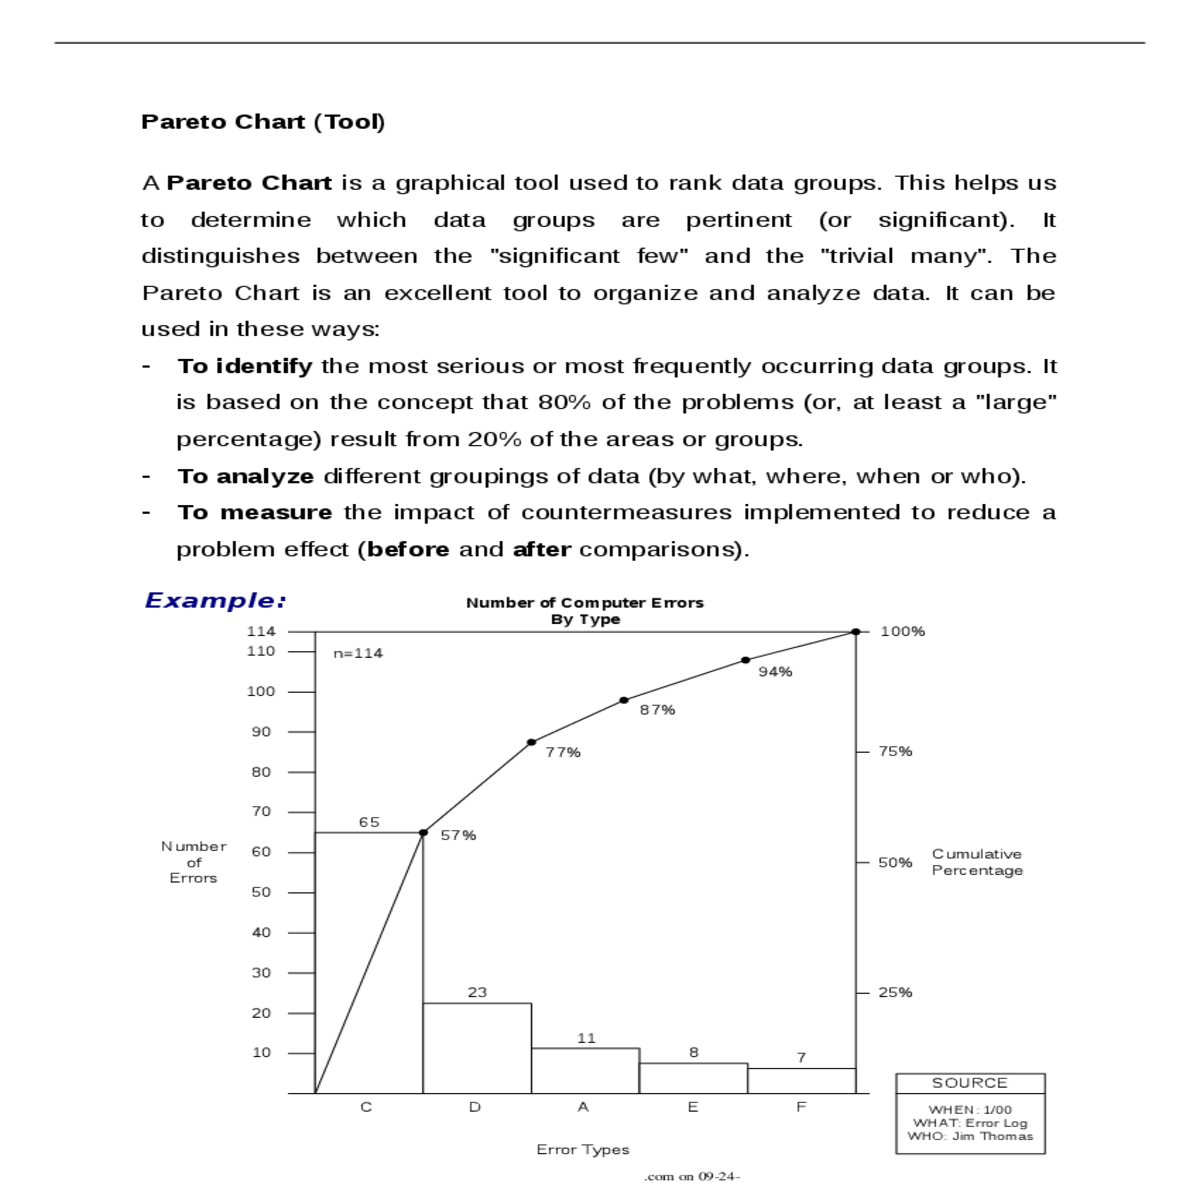
The pareto chart excellent tool organize and analyze data
Pareto Chart (Tool)
|
|
100% | |
|---|---|---|---|
| By Type | |||
| 114 | |||
| 110 |
| 10 | 8 |
|
|---|
SOURCE
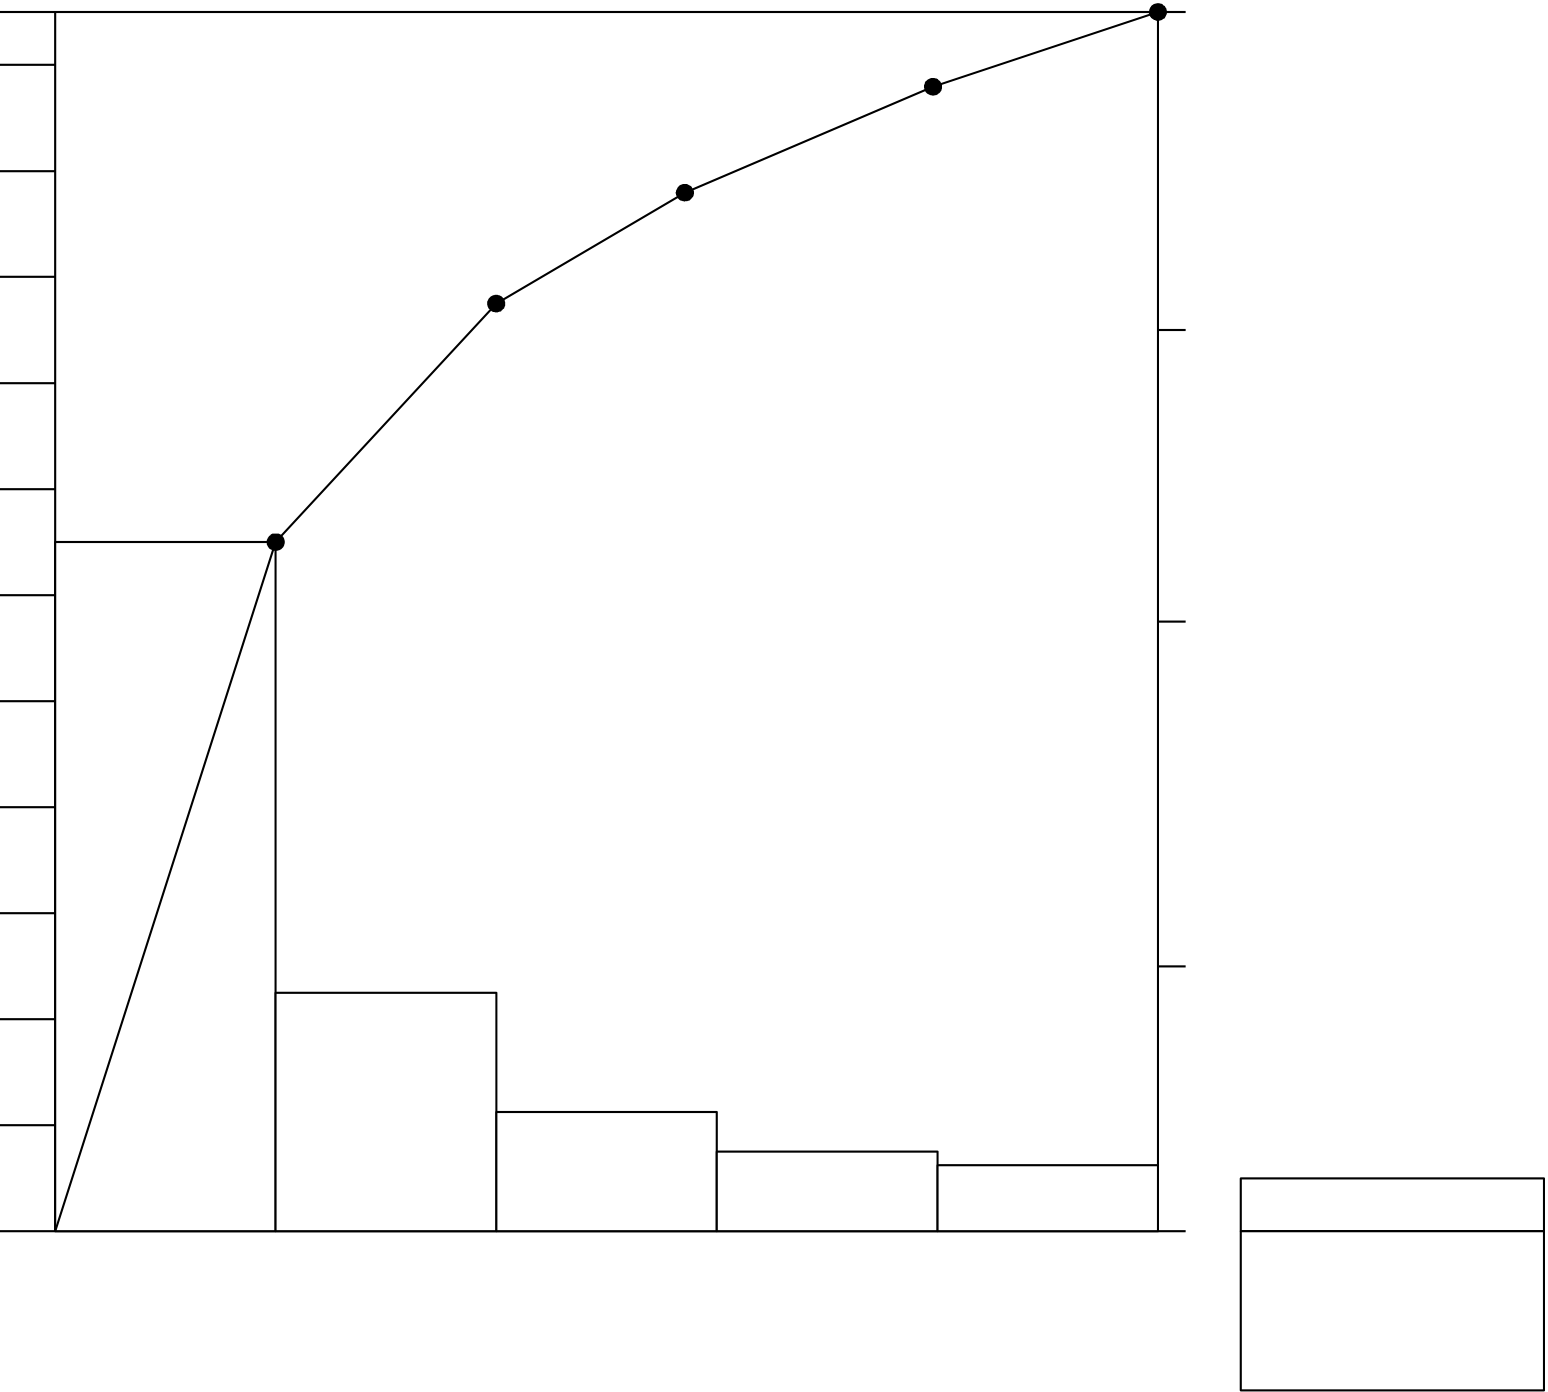
1. Draw a box.
2. Display the number of items in the upper left corner as shown below (n=101).
5. Add a source box.
3 of 6
| Purpose |
|---|
| | Team 1 & 4 will construct a Pareto diagram for plant |
|---|
Team 3 & 6 will construct a Pareto diagram by the three plants in which the plant failures occur (without regard to cause) contained in the checksheet on the next page.
Each team should construct the Pareto chart and then reconvene to share the final result.
| | 4 of 6 | |
|---|---|---|
| | ||
| .com on 09-24-2022 20:07:55 GMT -05:00 |
The XYZ Power Company has been experiencing a problem with equipment failures. The company decided to do an analysis of the causes of these failures. Five Failure Modes were noted as occurring at least once.
A checksheet was constructed to record the cause of each failure by plant and by manufacturer. The five Failure Modes were as follows (with corresponding symbols to be used on the form for an occurrence):
Failure Mode Causes:
| C | - | |
|---|---|---|
| # | - |
|
| | - |
|


