

The median survival time the average the and ordered survival times
1
|
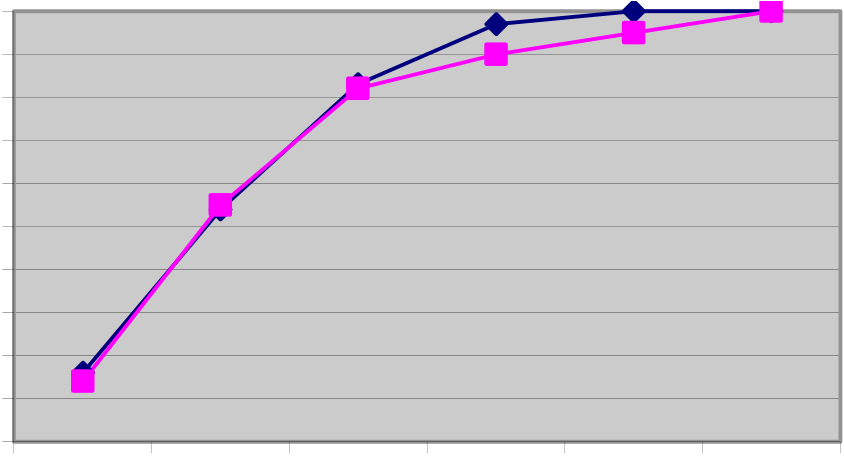
b. (2 points)
Construct a figure that displays simultaneously the cumulative relative frequency distribution for nonsmokers and smokers.
|
|||||||||||||||||||||||||||||||||||||||||||||
|---|---|---|---|---|---|---|---|---|---|---|---|---|---|---|---|---|---|---|---|---|---|---|---|---|---|---|---|---|---|---|---|---|---|---|---|---|---|---|---|---|---|---|---|---|---|
Practicetest1_solutions.doc
2
|
||||||||||||||||||||
Note – If your solution used the midpoints of the intervals to obtain guesses of the 25th and 75th percentiles, I will give you full credit - cb.
|
||||||||||
Construct a box plot for systolic blood pressure among non-smokers.
|
|---|
4. (10 points)
a.
|
5
d.
|
|---|
Practicetest1_solutions.doc
6
1.
|
|||||||||||||||||||||||||||||||||||||||||||||||||||||||||||||||||||||||||||||||||||||
|---|---|---|---|---|---|---|---|---|---|---|---|---|---|---|---|---|---|---|---|---|---|---|---|---|---|---|---|---|---|---|---|---|---|---|---|---|---|---|---|---|---|---|---|---|---|---|---|---|---|---|---|---|---|---|---|---|---|---|---|---|---|---|---|---|---|---|---|---|---|---|---|---|---|---|---|---|---|---|---|---|---|---|---|---|---|
|
|||||||||||||||||||||||||||||||||||||||||||||||||||||||||||||||||||||||||||||||||||||
2.
| = | ∑ all values of number correct |
[(value of number correct - X) ] | frequency in class |
|
5 |
|
|||||||||||||||||||
|---|---|---|---|---|---|---|---|---|---|---|---|---|---|---|---|---|---|---|---|---|---|---|---|---|---|
| class size - 1 | |||||||||||||||||||||||||
| 2 | + | [ (9-7.767) ] | 8 |
|
+ | [ (8-7.767) ] |
|
16 | + | [ (7-7.767) ] | 12 | + | [ (6-7.767) ] | ||||||||||||
| 42 | 42 | 42 | 42 | 42 | |||||||||||||||||||||
| = | |||||||||||||||||||||||||
Sample standard deviation
= S 2
= 1.0875
=1.0428Practicetest1_solutions.doc
b.
|
|---|
|
|
|
b.
|
|---|
|
11
9.
|
|---|
|
|
|---|
|


