

Sol fall introductory biostatistics page excel worksheet
BIOSTATS 540 – Fall 2015 Introductory Biostatistics Page 1 of 10
Unit 9 – Regression and Correlation
Homework #14 (Unit 9 – Regression and Correlation)
|
||
|---|---|---|
| (per capita in 1930) |
|
|
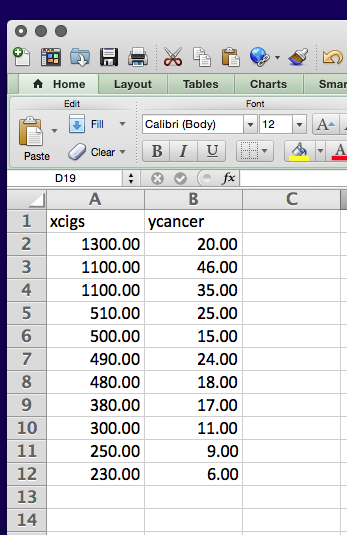
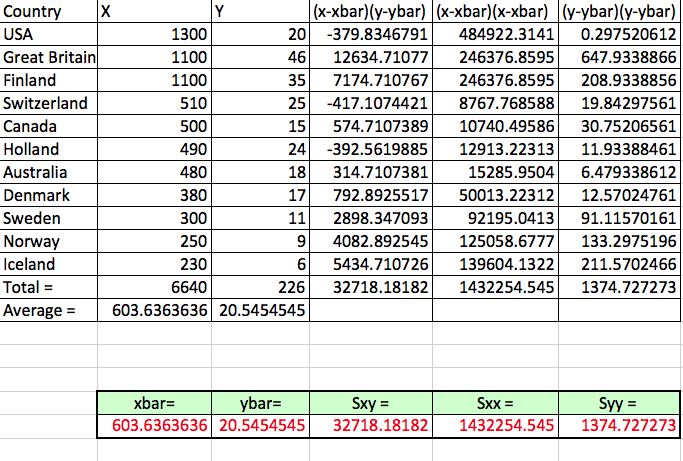
| 1300 | 20 | |
| 1100 | 46 | |
| 1100 | 35 | |
| 510 | 25 | |
|
500 | 15 |
|
490 | 24 |
| 480 | 18 | |
| 380 | 17 | |
| 300 | 11 | |
| 250 | 9 | |
|
230 | 6 |
sol_regression.docx
From here, you can copy and paste your data into an appropriate application.
|
|---|
|
|---|
Scatterplot Using Stata
variable | min max
|
|---|
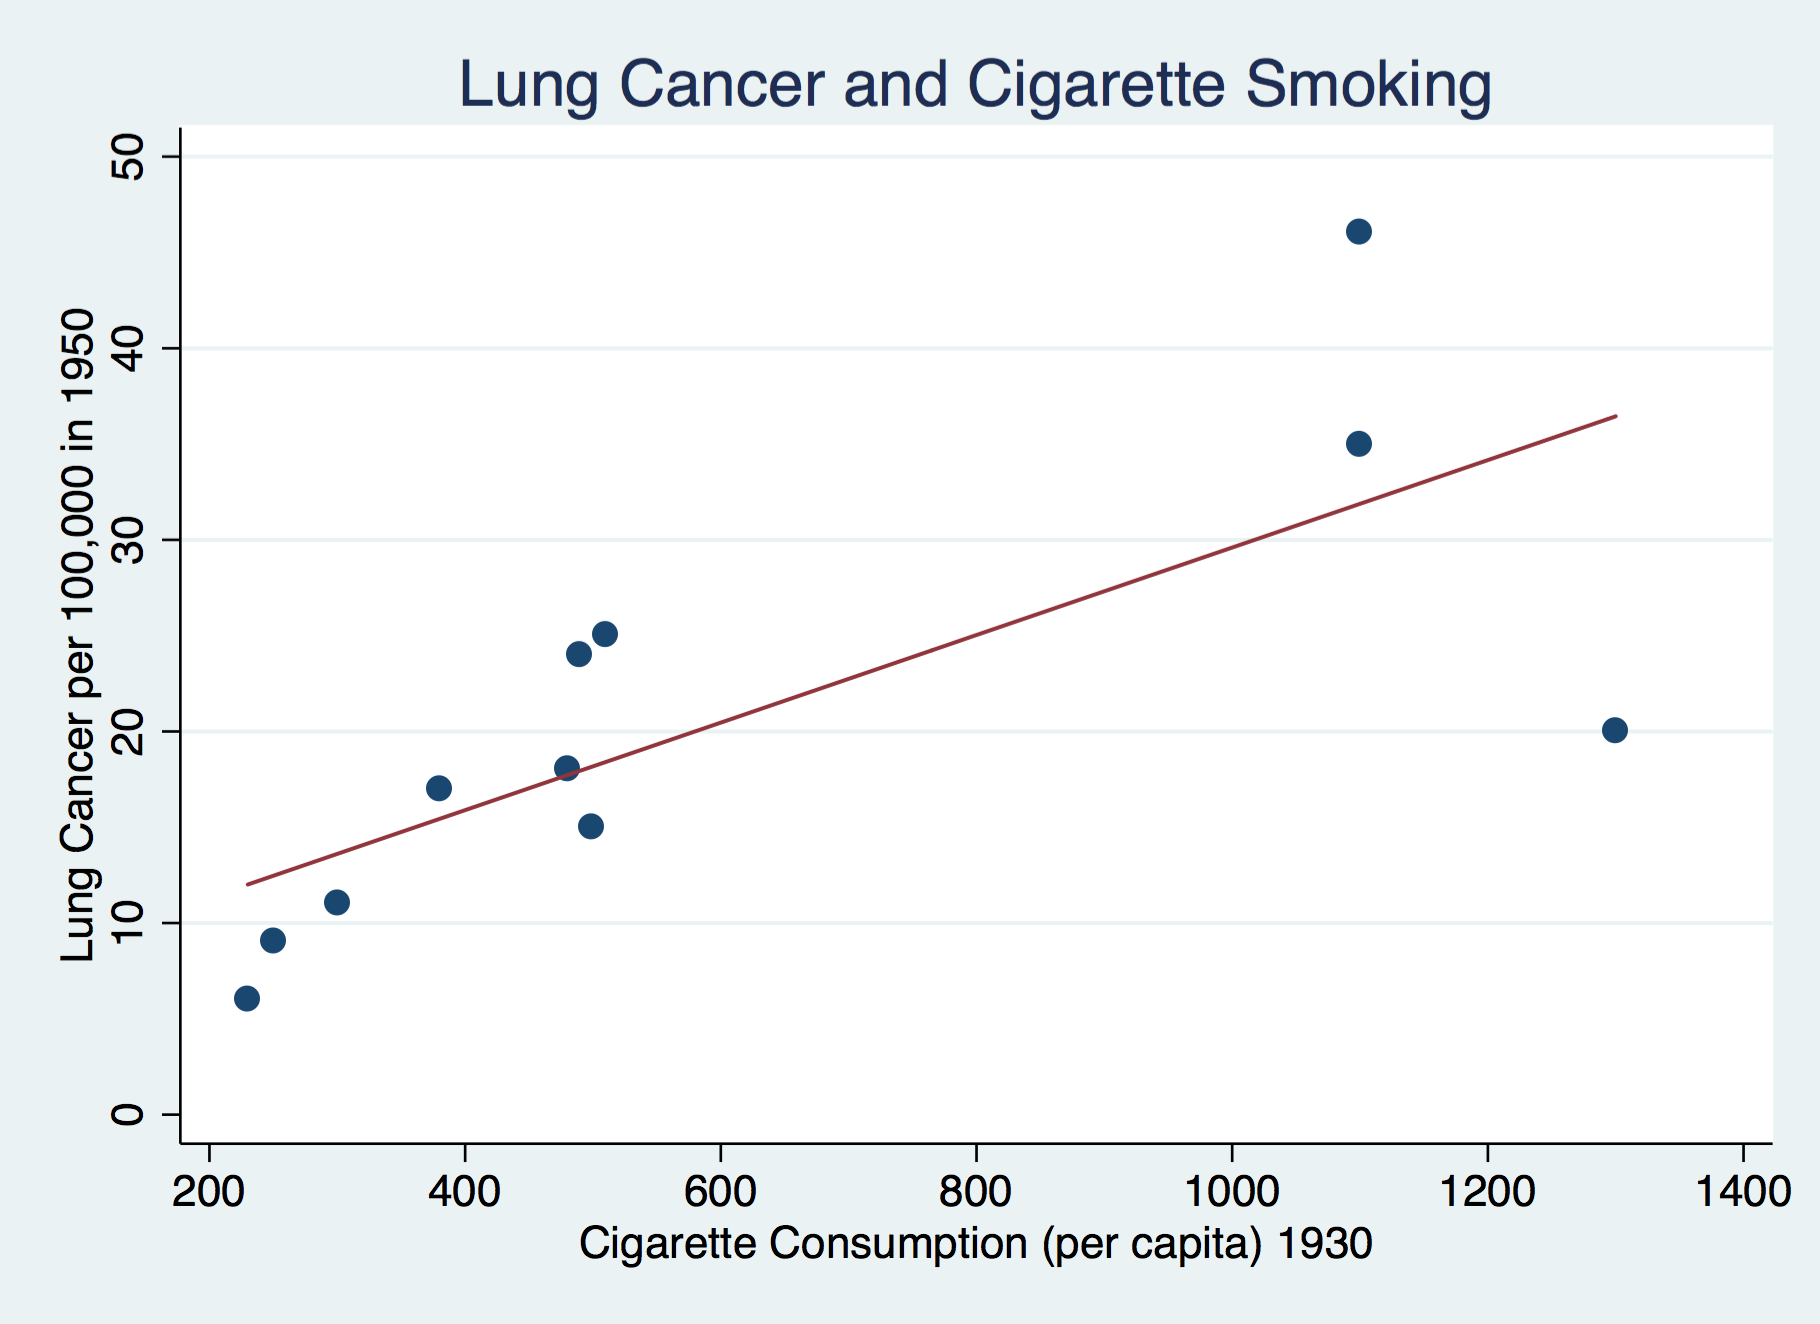 |
2. Interpret the graph you produced in exercise #1 with respect to form, direction, and strength.
This scatter suggests a linear relationship between cigarette consumption (X) and lung cancer cases (Y) that is positive, with higher cigarette consumption being associated with higher numbers of cancer cases. There are no outliers. However, there are more data in the lower left quadrant of this plot; thus, the full nature and strength of the association may be difficult to assess.
11 i=1 |
(Xi − X | ) | (Yi −Y | |||
|---|---|---|---|---|---|---|
| (Xi − X |
|
|||||
11 |
(Yi −Y | ) | 2 | = 1374.727273 | ||
 |
|---|
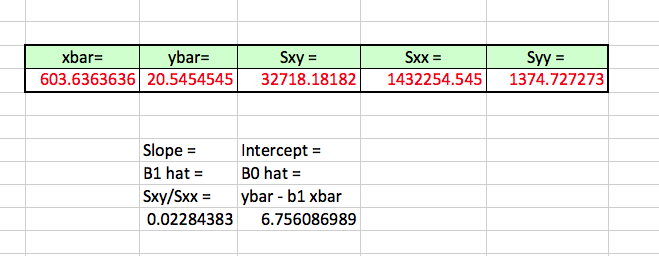
4. Now you have what you need to solve for the least squares estimate of the slope and intercept.
By hand, or using Excel, or using any software you like, calculate the values of the following:
| (Xi − X | ) Yi −Y | ) |
|
=SXY⎡ |
|
||||||||
|---|---|---|---|---|---|---|---|---|---|---|---|---|---|
| 1 | ⎢⎢⎣ | (Xi − X | ) | ⎥⎥⎦ | ⎣⎢SXX | ||||||||
b) Estimated intercept, ˆβ0 = Y −ˆβ1X= 20.5454545 – (0.0228*603.6363636) = 6.756086989
sol_regression.docx
 |
|---|
A unit increase in X = per capita consumption of cigarettes (in 1930) is estimated to be associated with a .02 increase in Y = the number of lung cancer cases per 100,000 in 1950.
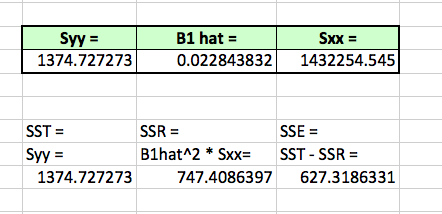
6. By hand, or using Excel, or using any software you like, calculate the values of the following sums of squares that are in the analysis of variance:
| (Yi −Y |
|
|---|
hint – This is the same as SYY in #3
| ( ˆYi−Y | =ˆβ1 2 | 11 i=1 |
(Xi − X | ) | 2 |
|---|
i=1 |
(Yi− ˆY |
|
|---|
Excel Worksheet:
|
|
||||||||
|---|---|---|---|---|---|---|---|---|---|
|
|||||||||
|
|
||||||||
|
(n-1) = 10 |
|
sol_regression.docx
BIOSTATS 540 – Fall 2015 Introductory Biostatistics Page 10 of 10
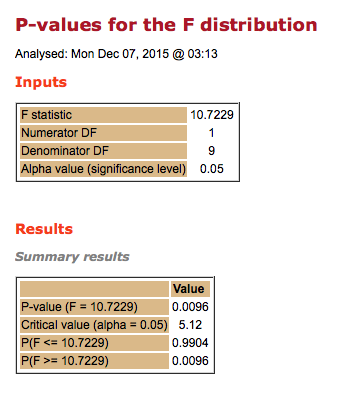
http://epitools.ausvet.com.au/content.php?page=f_dist


