

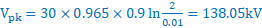
Sketch the bewley lattice diagram indicatingsignificant values
lOMoARcPSD|16107334
GENERAL SIR JOHN KOTELAWALA DEFENCE UNIVERSITY
| 13 July2020 |
|---|
1. (a) By deriving any equations used, determine the voltage at which corona inception would occur in
a 3, 50Hz, transmission line with 20 mm diameter stranded ACSR conductors spaced 2m apart,
| |  (or (or  |
[3 marks] |
|---|
The start of the Townsend’s breakdown process is the avalanche process in the breakdown of gaseous dielectrics. If a free electron exists in the gas where an electric field exists, then if the field strength is sufficiently high, then it is likely to ionize a gas molecule by simple collision resulting in 2 free electrons and a positive ion. The process is cumulative, and the number of free electrons will go on increasing as they continue to move under the action of the electric field. The swarm of electrons and positive ions produced in this way is called an electron avalanche.
|
||||||||||
|---|---|---|---|---|---|---|---|---|---|---|
|
dnx | |||||||||
| Therefore | dnx = | α . nx . dx | ||||||||
| x | d | n | x | x = dx 0 |
||||||
| n | x | |||||||||
| n | 0 | |||||||||
| log e ( n | x n / 0 |
|
||||||||
| n = n 0 e . x | ||||||||||
If the anode is at a distance x = d from the cathode,
then the number of electrons nd striking the anode per second is given by
nd = n0 . eαd
on average, each electron leaving cathode produces (nd - n0)/n0 new electrons (and corresponding positive ions) in the gap.
| = |
|
|---|
collision in the gap. [Townsend's second ionisation coefficient]
lOMoARcPSD|16107334
Then n0' = n0 + n0"
On the average, each electron leaving the cathode produces [eαd - 1] collisions in the gap, giving the number of ionising collisions/second in the gap as n0" (eαd - 1).
| = | n 0 | ' | ||||||||||||
|---|---|---|---|---|---|---|---|---|---|---|---|---|---|---|
| n 0 e ( "d | ) 1 - | |||||||||||||
| giving | n | 0 = | n | 0 e ( "d | ||||||||||
| but | n | 0 n = " | 0 n + | |||||||||||
| n | 0 n = " | 0 n + |
|
|||||||||||
| This |
|
|||||||||||||
| n | n | |||||||||||||
Similar to the case of the primary process (with α only),
|
= | |||
|---|---|---|---|---|
| - 1( ed | ) 1 - | |||
| [7 marks] |
|---|
gradient = = 0.68/5 = 0.136
| substitution of d = 16 mm, I = 450 = | 14.44 e | .0 136 16 | = |
|
||||||||||
|---|---|---|---|---|---|---|---|---|---|---|---|---|---|---|
| 1 | − | e | .0 136 16 | − | )1 | 1 | − | ( .8 811 | − | )1 | [7 marks] | |||
The avalanche process is one that occurs in the breakdown of gaseous dielectrics and is based on the generation of successive ionising collisions leading to an avalanche.
| anode (+) |
|---|
The electric field Eb in a gas bubble which is immersed in a liquid of permittivity ε1 is given by
| E = |
|
|---|
ii) Breakdown due to liquid globules
If an insulating liquid contains in suspension a globule of another liquid, then breakdown can result from instability of the globule in the electric field.A spherical globule of liquid of permittivity ε2 immersed in a liquid dielectric of permittivity ε1, when it is subjected to an electric field between parallel electrodes, the field inside the globule would be
|
ε2/ε1 = |
|
|---|
lOMoARcPSD|16107334
When ε2 >> ε1 (generally when ε2/ε1 > 20), and the field exceeds a critical value, no stable shape exists, and the globule keeps on elongating eventually causing bridging of the electrodes, and breakdown of the gap. When ε2/ε1 >> 20, the critical field at which the globule becomes unstable no longer depends on the ratio, and is given by Ecrit.
| F = 1 2 r | 2 + 2 1 |
E |
|
|---|
Heat is generated continuously in electrically stressed insulation by dielectric losses, which is transferred to the surrounding medium by conduction through the solid dielectric and by radiation from its outer surfaces. If the heat generated exceeds the heat lost to the surroundings, the temperature of the insulation increases.
The simplest case is where the loss of heat by cooling is linearly related to the temperature rise above surroundings, and the heat generated is independent of temperature. (i.e. the resistivity and the loss angle do not vary with temperature).
Page 4 of 17
lOMoARcPSD|16107334
| E1 | E2 |
|---|
For the field E2, a stable temperature θA exists (provided the temperature is not allowed to reach θB). For the field E1, the heat generated is always greater than the heat lost so that the temperature would keep increasing until breakdown occurs.
The maximum voltage a given insulating material can withstand cannot be increased indefinitely simply by increasing its thickness. Owing to thermal effects, there is an upper limit of voltage Vθ, beyond which it is not possible to go without thermal instability. This is because with thick insulation, the internal temperature is little affected by the surface conditions. Usually, in the practical use of insulating materials, Vθ is a limiting factor only for high-temperature operation, or at high frequency
| (f) | |||
|---|---|---|---|
|
|||
Static
Page 5 of 17
lOMoARcPSD|16107334
| R | | Res = | |||||||||
|---|---|---|---|---|---|---|---|---|---|---|---|
| r | x Δx | |
|
||||||||
|
|||||||||||
| Res = | R | dx | = | ||||||||
| r |
x | ||||||||||
[4 marks]
For a single core cable
consider an elemental cylinder of radius x and thickness dx, and of length unity along the cable.
| S | = | k | n 2 r | [4 marks] |
|---|---|---|---|---|
| 2 | r 1 |
A 220 kV, 50 Hz three phase system has a single phase cable buried in the ground at a depth of 1.5 m below the surface. If the diameter of core is 38 mm, diameter over insulation is 90 mm, relative permittivity of insulation is 4.2, and the thermal resistivity of insulation is 5.4oC-m/W determine the thermal resistance of the cable.
| S | = | r 2 | = | 4.5 | n 90 | = | .0 741 |
|
[3 marks] | |
|---|---|---|---|---|---|---|---|---|---|---|
| r 1 | 2 | 38 | ||||||||
| (c) | The insulation of a single phase, 76kV high voltage cable has a critical breakdown stress of 180 | |||||||||
| R | r1 | |||||||||||||||||||||
|---|---|---|---|---|---|---|---|---|---|---|---|---|---|---|---|---|---|---|---|---|---|---|
| 180 | 2 | = | 9.0 | = | r 1 |
|
r | |||||||||||||||
| 2 | | ln |
|
ln | ||||||||||||||||||
| ln | r 1 | = | .0 663 | → | r 1 | = | ||||||||||||||||
| [8 marks] | ||||||||||||||||||||||
| ln | = | .0 342 | → | R | = |
|
||||||||||||||||
| .1 747 | a | |||||||||||||||||||||
| (d) |
|
|||||||||||||||||||||
| a | a | |||||||||||||||||||||
| b | b | b | ||||||||||||||||||||
| c | c | c | ||||||||||||||||||||
The continuity of each cable sheath is broken at regular intervals; the cables between two adjacent discontinuities being a minor section. 3 minor sections make up a major section, where the sheaths are solidly bonded together and to earth. To prevent excessive voltage build up, cross bonded points are earthed through non-linear resistors which limit voltage build up. [7 marks]
3. (a) Describe briefly, with the aid of suitable diagrams the cascade arrangement of transformers to obtain high alternating voltage for testing purposes. [5 marks]
units each rated at 100 kV insulation. The low voltage winding is connected to the primary of the first
transformer, and this is connected to the transformer tank which is earthed. One end of the high
high voltage. The secondary of this transformer too has one end connected to the tank and at the
other end the next cascaded transformer is fed.
regulation. This is to ensure that when the secondary of the transformer is short circuited (as will
commonly happen in flash-over tests of insulation), the current would not increase to too high a
generation. [5 marks]
Lightning is an electric discharge in the form of a spark or flash originating in a charged cloud where the
+ +++++ + + + + +
+ + +++++++ + + + + + + + + + cloud
- - - - - - - - - - - - - - - - - -
- - + ++ + - - - - - - - -50C - - -


tower
Line═════════ earth plane ══════════════════════════════════════════════════
their ends with the onset of corona discharges. Drops of radius 2 mm develop streamers in fields
exceeding a 9 kV/cm. The high field need only be very localised, because a streamer starting from one
+ + + + + + + + + + + + + + + + + + + +
+ + + + + + + +
- - - -
- - - - - - - -
- - - - - -
- -
+
+ +
Propagation of lightning channel
When the electric field in the vicinity of one of the negative charge centres builds up to the critical value
process continues a number of times, each step increasing the channel length by 10 to 200 m. Because
of the step like sequence, this process is termed the stepped leader stroke. When eventually the
Following the first, or main stroke and after about 40 ms, a second leader stroke propagates to earth in
a continuous and rapid manner and again a return stroke follows. This second and subsequent leader
ms, but is most frequently 40-50 ms. The average duration of a complete flash being about 250 ms.
[5 marks]
l.v. h.v.
spring
| A | |||||
|---|---|---|---|---|---|
| x | |||||
| | - = F | 1 | N | ||
| 2 | |||||
In this meter, the electrostatic force is balanced by a spring force as shown. The right hand electrode forms the high voltage plate, while the centre portion of the left hand disc is cut away and encloses a small disc which is movable and is geared to the pointer of the instrument. The purpose of this is to keep the field roughly constant as movement occurs only on a small section. The range of the instrument can be altered by setting the right hand disc at pre-marked distances. The two large discs form adequate protection for the working parts of the instrument against external electrostatic disturbances. These electrostatic instruments can be used to measure both a.c. and d.c. voltages. [5 marks]
| C | = | A | = | | =constant |
|---|---|---|---|---|---|
| d | x |
i.e. Δy/Δx = constant (usually chosen as 1 for convenience of drawing). Thus curvilinear squares are formed in the sketch.
Considering the instant of time when A is at peak (1.0) and B and C are at half value (-0.5) the flux lines and the equipotential lines may be drawn as follows [4 marks]
(e) Describe the Cockroft-Walton method of generating high direct voltages for testing purposes. [7 marks]
+HT
d
| a |
|
0 |
|
0 | |||
|---|---|---|---|---|---|---|---|
| 0 | |||||||
[3 marks]
Vmax is the peak value of the secondary voltage of the high voltage transformer. To analyze the behaviour, consider that charging of capacitors actually takes place stage by stage rather than somewhat simultaneously.
Thus after charging up has taken place, the voltage at c varies between 2 Vmax and 4 Vmax. Assuming C4 also to be initially uncharged, since the voltage at b is a constant at 2 Vmax and the voltage at c varies between 2 Vmax and 4 Vmax initially, during most of the cycle, the diode D4 is forward biassed and C4 charges up to the maximum difference between d and b (i.e. to 2 Vmax). This occurs when the voltage at c is 4 Vmax and the voltage at d would now be 4 Vmax. As the voltage at c falls from 4 Vmax to 2 Vmax, since the capacitor C4 has charged up it would not discharge, since there is no discharge path. Thus once the capacitors are charged up the voltage at d remains constant at 4 Vmax. [4 mark]
Page 11 of 17
With brief explanation about matching, stray capacitance etc. [5 marls]
[End of Question Paper]
| (b) | D | |||
|---|---|---|---|---|
| (c) |
|
100 | ||
|
||||
| (d) |
|
|||
|
||||
| Supply | ||||
|
|
|||
| (e) | ||||
| C | 2 |
|
|
= | ||||||||||||||||
|---|---|---|---|---|---|---|---|---|---|---|---|---|---|---|---|---|---|---|---|---|
| C | 1 | 2 | ||||||||||||||||||
| = | ||||||||||||||||||||
| C 1 | ||||||||||||||||||||
|
|
= | ||||||||||||||||||
| r | = | C d | = | 20 | | 10 | −12 | | ||||||||||||
| 0 | | A | .8 854 10 | −12 | | .0 01 | ||||||||||||||
Thus
| Z | 1 | −/ 2 | + | 1 | ) | = | Z | 4 | | | V | |||
|---|---|---|---|---|---|---|---|---|---|---|---|---|---|---|
| Z | 2 | −/ 2 | + | 2 | ) | Z | 3 | −3 | ||||||
| i.e. | ||||||||||||||
1/C1P = 0.00728 → P = 1/(1002010- 120.00728) = 21,862 M
Page 13 of 17
| C1 |
|
Q |
|---|
D
tangent of an insulating liquid
|
brass | 3mm gap |
|---|---|---|
| brass | ||
| electrode | test cell | |
The test cell is connected in parallel with a variable capacitor and made
part of a constant current resonant circuit.
| (d) | Vm | ||||
|---|---|---|---|---|---|
| The circuit is then de-tuned to the half-power | C-C C+ |
||||
| points (voltage corresponding to 1/2) from | |||||
| which the value of the effective Q-factor is | |||||
| If C+ and C– are the values at the half power | |||||
| points, then it can be shown that the Q factor | |||||
C + - C- |
= 2 C + ( C + - C ) |
||||
| where C+ and C– are the variations at the | |||||
| C = C = C , |
|
|
|---|
One-minute Rain test: The insulator is sprayed throughout the test with artificial rain drawn from a source of supply at a temperature within 10o C of the ambient temperature of the neighbourhood of the insulator. The rain is sprayed at an angle of 45 o on the insulator at the prescribed rate of 3 mm/minute. The resistivity of the water should be 100 ohm-m ± 10%. The prescribed voltage is maintained for one minute.
Sample Tests test the sample fully, up to and including the point of breakdown. These are done only on a few samples. An example for an insulator is given below.
Page 15 of 17
lOMoARcPSD|16107334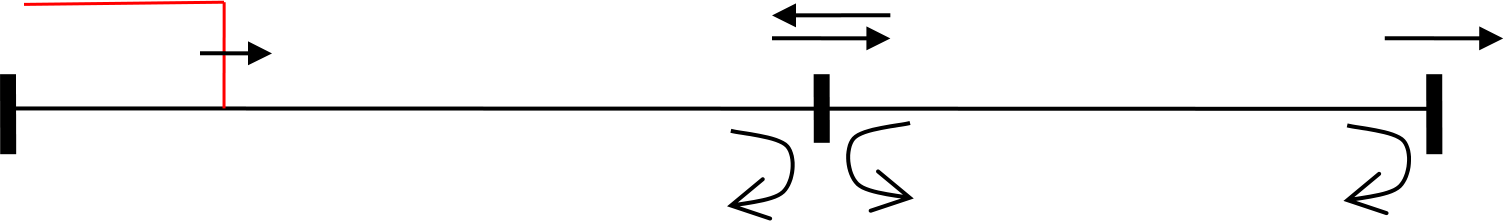
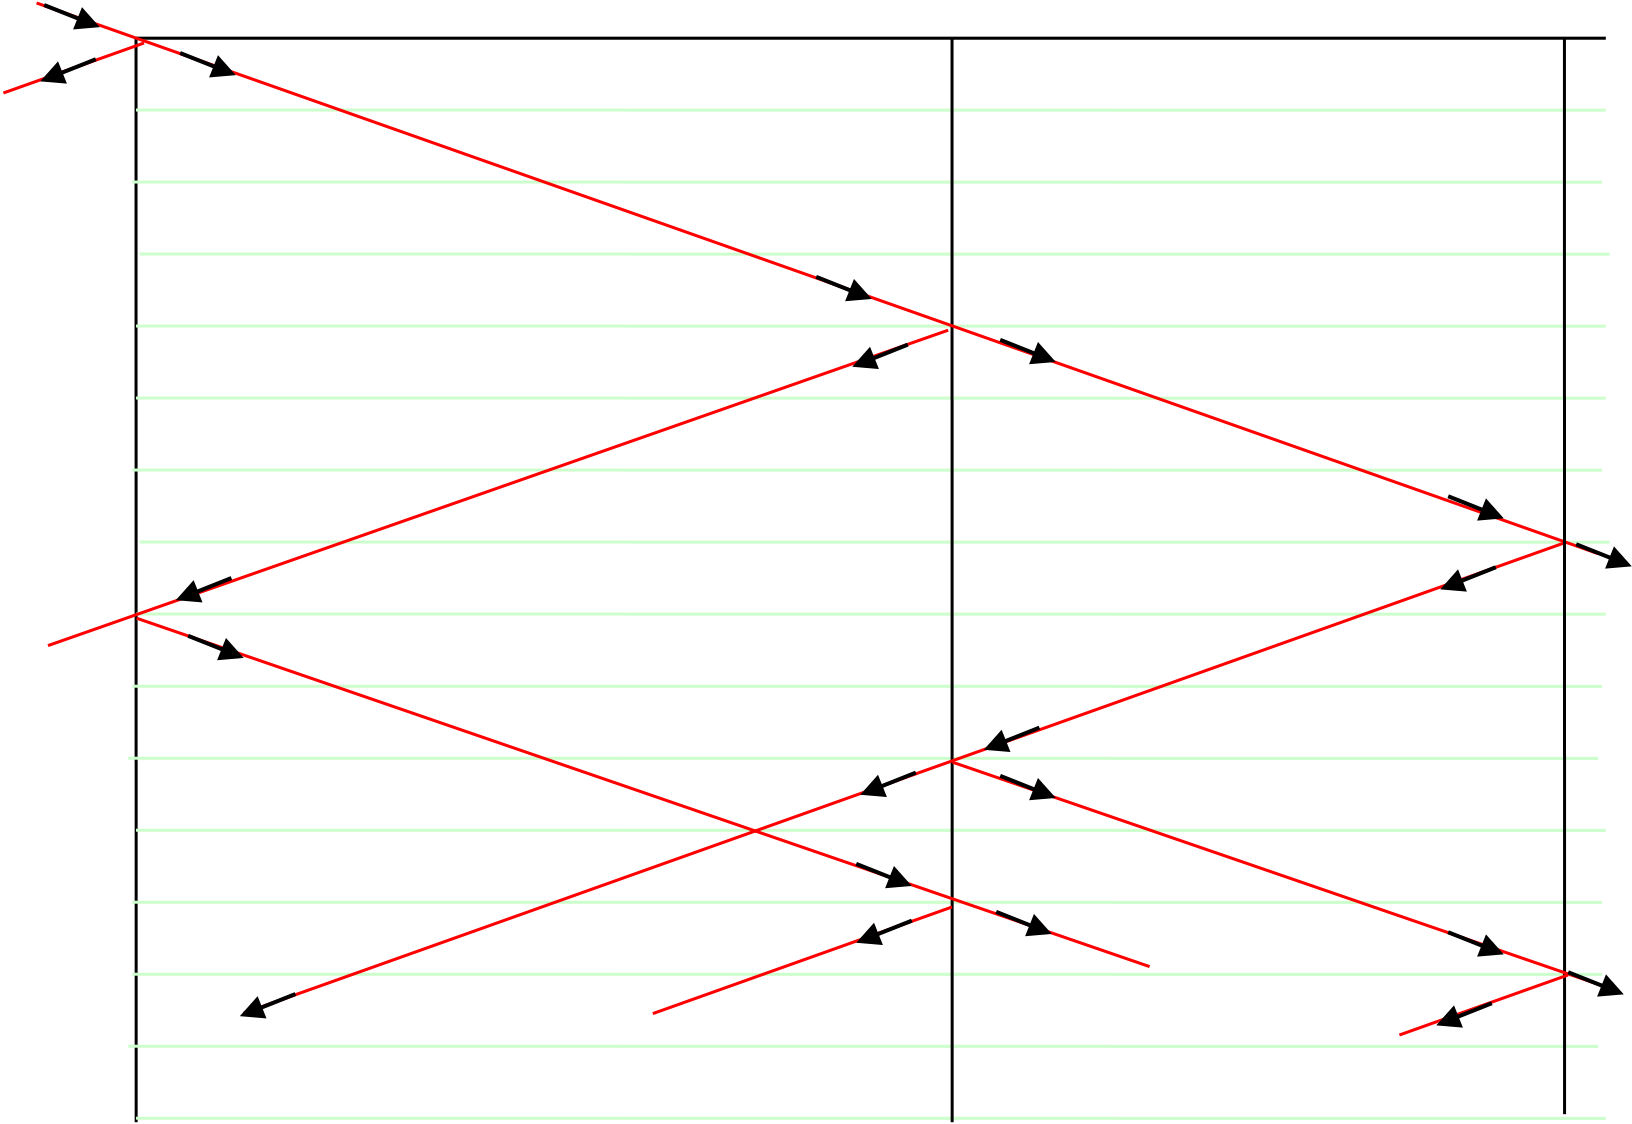
transmission coefficient at B = 1 + 0.125 = 1.125 and 1 − 0.125 = 0.875
|
1550 | − | 450 | = | |
|---|---|---|---|---|---|
| 1550 | + | 450 |
141.4 kV
| 200 s |
|---|
− 8.09
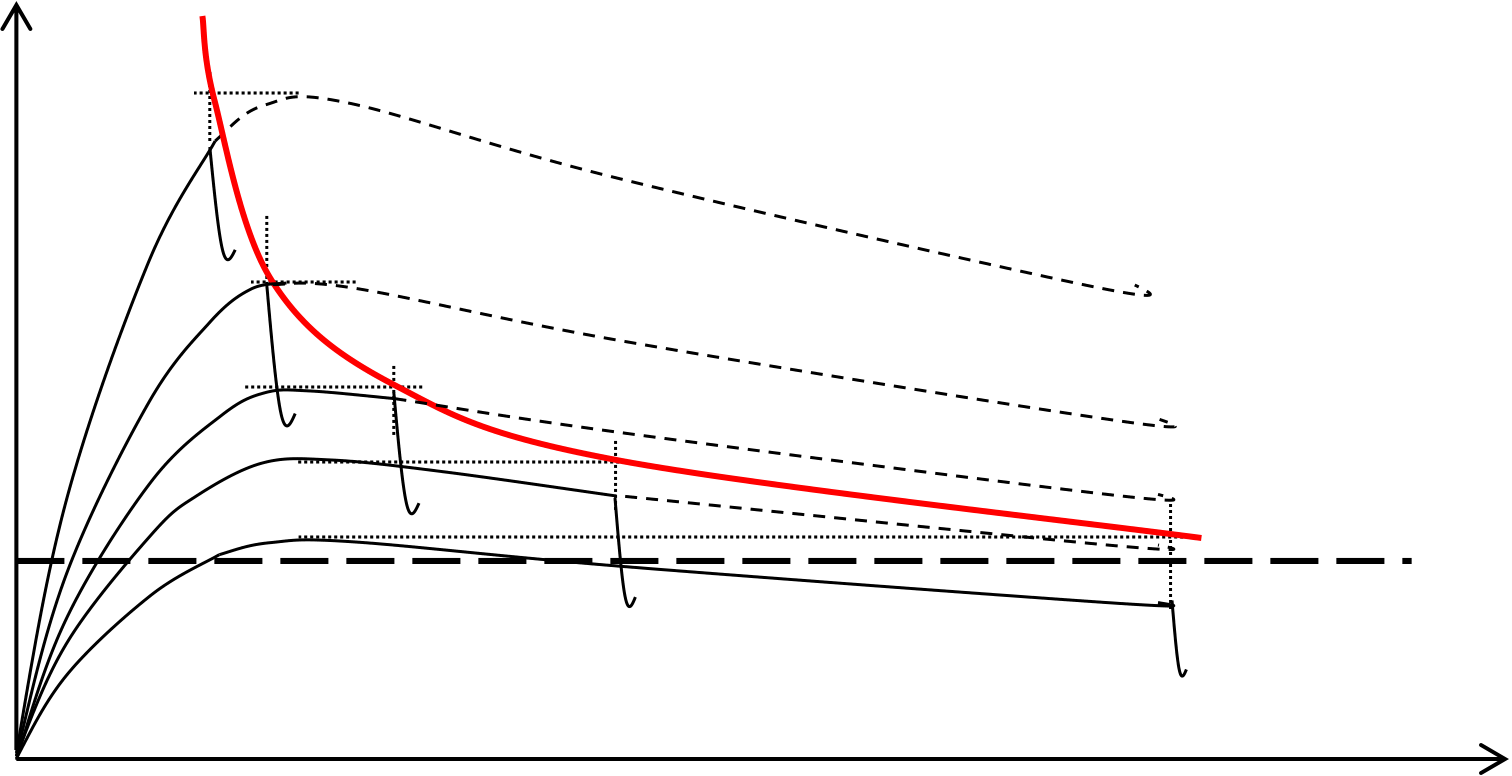
(b)Sketch, indicating significant values, the voltage at B for the first 1.4 ms after the surge is initiated at A. [5 marks]
The waveform of the voltages at B is
| 38.5 kV | 127.1 kV | −6.7 kV | |
|---|---|---|---|
C (open)
Figure Q1b
C (open) 50 400 |
||||
|---|---|---|---|---|
| 200 kV | ||||
| A | ||||
| 400 , 90 km | ||||
| Derivation of the equivalence of the above circuit as | 400 | |||
Page 17 of 17


