

Singapore tel cygnus business consulting research pvt


| Industry Monitor | |
|---|---|
| FMCG |
| INDUSTRY AT A GLANCE ....................................................................................................2 |
|---|
Downloaded by in-iimlsingh from 59.165.151.7 at 2011-07-20 02:46:00 EDT. ISI Emerging Markets. Unauthorized Distribution Prohibited.
| Industry Monitor – FMCG | July 2011 |
|---|---|
INVESTMENTS & FINANCE
�Emami to strengthen R&D capability with new Rs120m centre, India �Emami increases marketing budget for Boroplus to Rs500m, India �ITC net profit rises 24% in Q4, India
© Cygnus Business Consulting & Research Pvt. Ltd., 2011 2
Downloaded by in-iimlsingh from 59.165.151.7 at 2011-07-20 02:46:00 EDT. ISI Emerging Markets. Unauthorized Distribution Prohibited.
| Industry Monitor – FMCG | July 2011 |
|---|---|
© Cygnus Business Consulting & Research Pvt. Ltd., 2011 3
Downloaded by in-iimlsingh from 59.165.151.7 at 2011-07-20 02:46:00 EDT. ISI Emerging Markets. Unauthorized Distribution Prohibited.
| Industry Monitor – FMCG | July 2011 |
|---|
India: Emami increases marketing budget for Boroplus to Rs500m
FMCG firm Emami has increased marketing budget for its flagship skincare brand 'Boroplus' to Rs500m this fiscal, in view of the brand getting into new categories like face wash within the year. The company, which plans to make Boroplus Rs5000m brand in the next two years, said it expects sales growth of 25 per cent this year with introduction of new products in the coming months. "As we line up to introduce a slew of products under 'Boroplus' brand this year, we are also increasing our marketing spend to Rs500m this fiscal. Last fiscal, we had spent around Rs300m on marketing and advertising," Emami Group of Companies Director Harsh Aggarwal told PTI.© Cygnus Business Consulting & Research Pvt. Ltd., 2011 4
Others
Asia-Pacific
India: Future Supply bets big on brand distribution
Future Supply Chain is betting big on its brand distribution service to modern trade. The company expects revenue of Rs1000m from this business segment by next year. The company had officially launched the new business of distributing products of FMCG brands to modern trade retail stores in April this year. At present the company handles 30 brands in categories like biscuits, soaps, cosmetics and namkeens. These products are distributed to 1,500 stores of 11 retailing chains. The company, which expects annual revenues of Rs6000m this year, has been increasingly providing warehousing services to companies other than those under the Future Group. Currently, 30% of the revenue comes from FMCG, electronics and apparel companies. Future Supply Chain expects this to go up to 50% in the coming years.India: Godrej plans to woo African market with its Darling buy
FMCG major Godrej Consumer Products (GCPL) has acquired 51% stake in Darling Group, a pan-African hair care company. In an interview with CNBC-TV18, Adi Godrej CMD of the company stated, Darling Group will be acquired in three stages and GCPL will ultimately buy 100% stake in the company. This acquisition, he stated, will give GCPL access to many African markets and is seen earning per share (EPS) accretive from the first year itself. "This will be a game changing acquisition for us," he added. Adi Godrej sees strong growth for GCPL in FY12. GCPL completed merger of Godrej Household Products Ltd with itself in March 2011. The FMCG major expects to generate an additional revenue of up to Rs20,000m in the next three-four years post merger.
| Industry Monitor – FMCG | July 2011 |
|---|---|
| Year | (000' MT) |
|---|---|
| 37.08 | |
|
35.90 |
|
42.50 |
| 54.18 | |
| 60.14 | |
| 67.06 | |
| 74.10 | |
|
81.50 |
|
89.25 |
| Source: India stat, Cygnus Research | |
Global Scenario
The soft drink industry is a global marketing phenomenon. In essence, it is simply a blended water drink with sweeteners, flavors and additives. The success in advertising and marketing this product lies in convincing billions of consumers to drink these instead of straight water or other less expensing alternatives. Pepsi and Coca-Cola, between them, hold the dominant share of the world market. Cadbury Schweppes follows a close third. Coca-Cola has approximately half of the world market share and sells 4 out of the top 5 soft drink brands in the world.© Cygnus Business Consulting & Research Pvt. Ltd., 2011 7
| Industry Monitor – FMCG | July 2011 |
|---|
ISIEmergingMarketsPDF in-iimlsingh from 59.165.151.7 on 2011-07-20 02:46:00 EDT. DownloadPDF.
© Cygnus Business Consulting & Research Pvt. Ltd., 2011 9
|
|||
|---|---|---|---|
| of alcoholic beverages across the states is not possible. UBL has a network of 23 distilleries across the country to meet the requirements at the regional level, giving it an unparalleled distribution reach within | |||
|
|||
|
|||
Kingfisher brand.
| 2010-11 | 2009-10 | 2008-09 | 2007-08 | |
|---|---|---|---|---|
| 27787.80 | 19972.30 | 16725.30 | 13408.00 | |
| 4307.80 | 2968.60 | 2675.30 | 1972.70 | |
| 15.50 | 14.86 | 16.00 | 16.81 | |
| 6.05 | 4.74 | 3.74 | 4.66 | |
|
1043.00 | 885.10 | 762.10 | 612.30 |
|
634.10 | 554.50 | 896.40 | 428.30 |
| 1679.80 | 945.90 | 625.00 | 624.70 | |
| 10 |
|---|
| Performance Analysis of United Breweries Ltd. | ||||||
|---|---|---|---|---|---|---|
| Quarterly Performance | Financial Year Performance | |||||
| JFM11 | JFM10 | Var (%) | 2010-11 | 2009-10 | Var (%) | |
| 8395.90 | 5731.50 | 46.49 | 27787.80 | 19972.30 | 39.13 | |
|
208.90 | 224.60 | (6.99) | 731.00 | 775.30 | (5.71) |
|
1250.30 | 877.80 | 42.44 | 4307.80 | 2968.60 | 45.11 |
| 232.60 | 125.10 | 85.93 | 634.10 | 554.50 | 14.36 | |
| 1017.70 | 752.70 | 35.21 | 3673.70 | 2414.10 | 52.18 | |
| 325.20 | 256.50 | 26.78 | 1043.00 | 885.10 | 17.84 | |
| 692.50 | 496.20 | 39.56 | 2630.70 | 1529.00 | 72.05 | |
|
291.60 | 234.70 | 24.24 | 950.90 | 583.10 | 63.08 |
|
400.90 | 261.50 | 53.31 | 1679.80 | 945.90 | 77.59 |
|
|
| Industry Monitor – FMCG |
|
||
|---|---|---|---|
|
Shareholding Pattern | ||
Downloaded by in-iimlsingh from 59.165.151.7 at 2011-07-20 02:46:00 EDT. ISI Emerging Markets. Unauthorized Distribution Prohibited.
| Industry Monitor – FMCG | July 2011 |
|---|---|
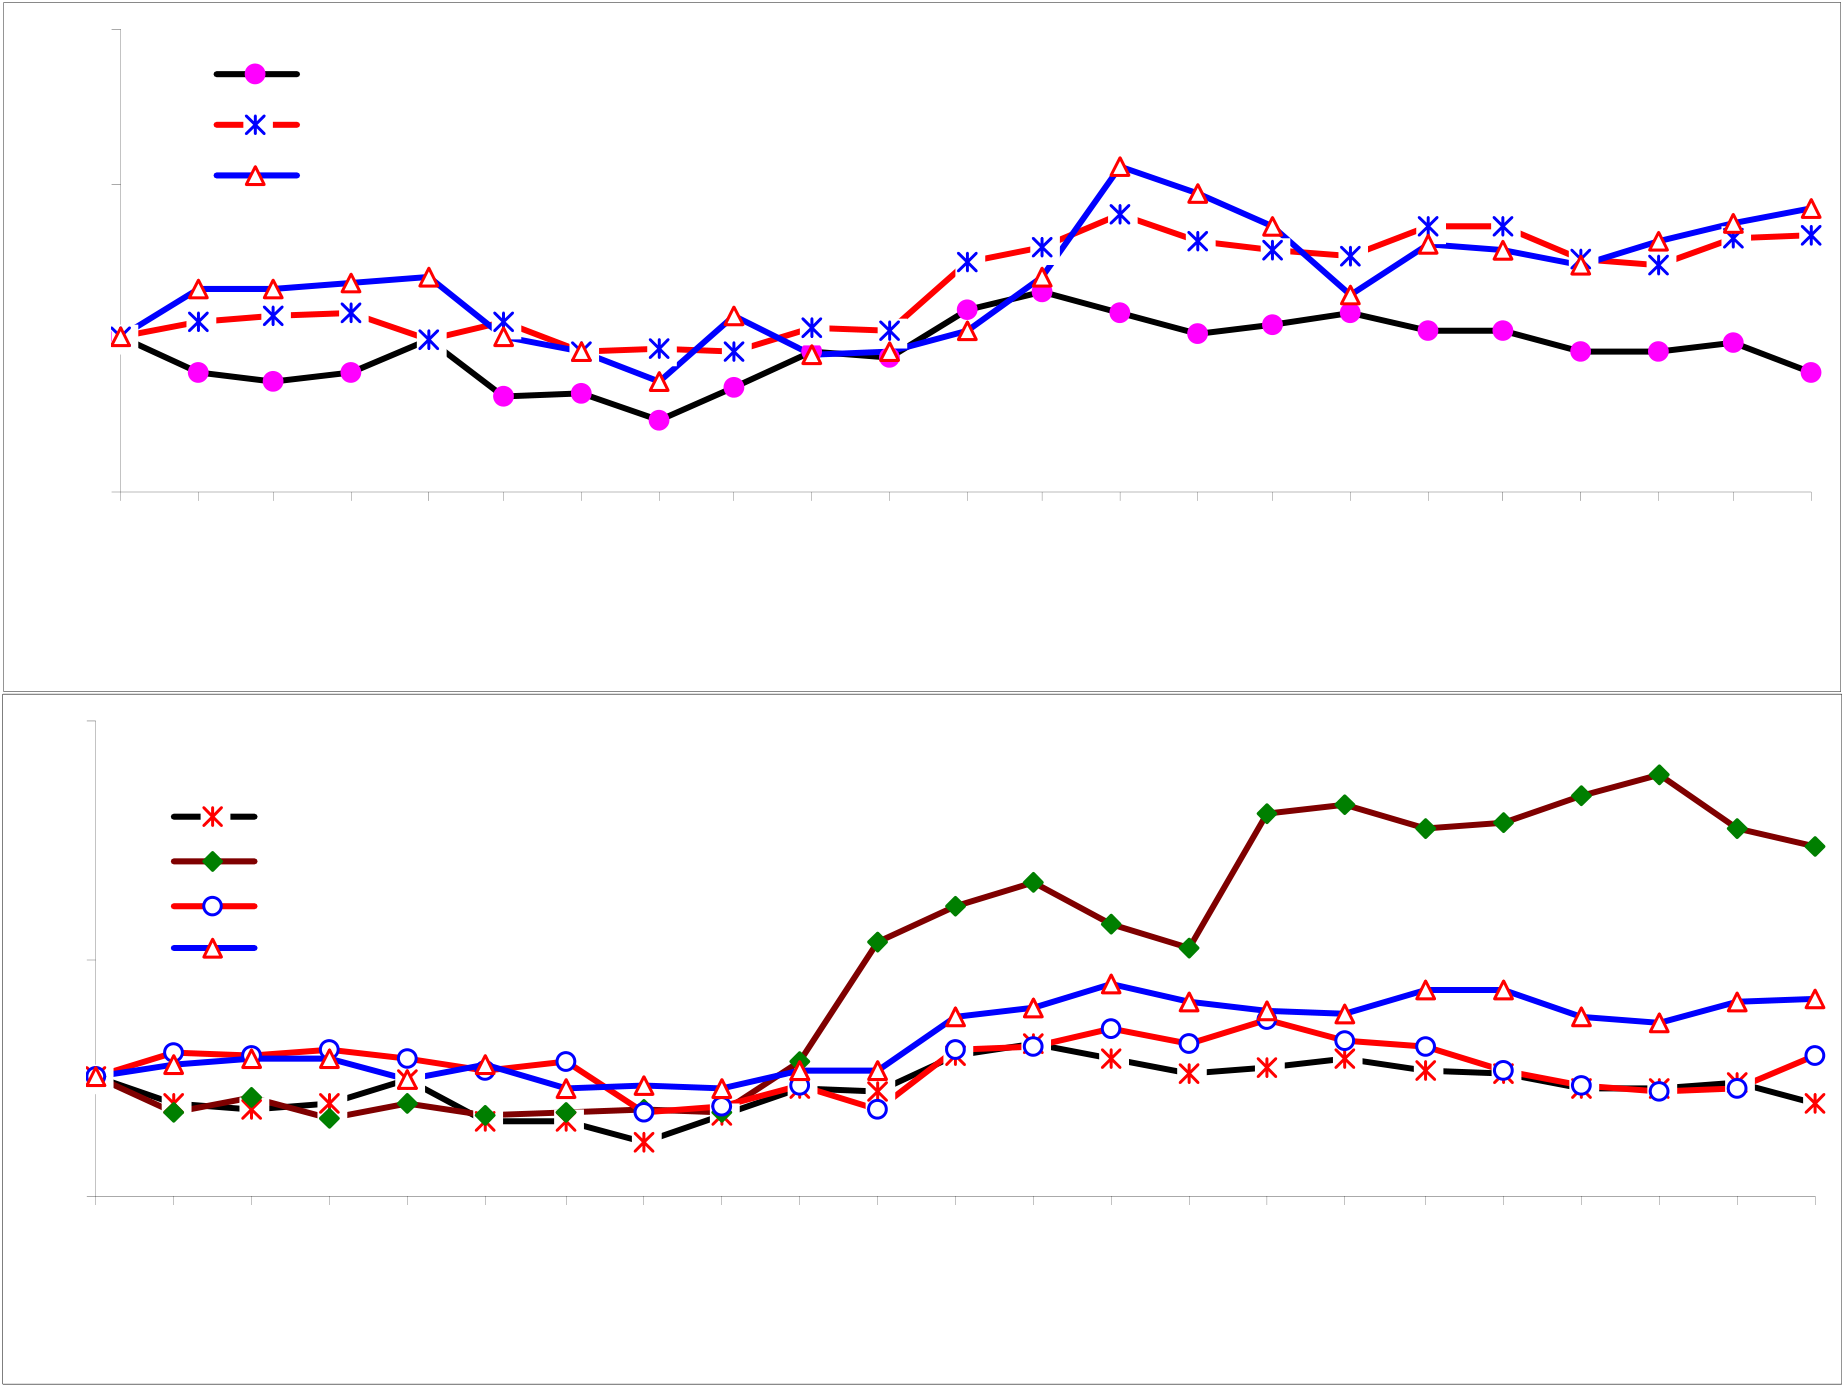
105 HUL
100
| 115 | 16/05/11 | 17/05/11 | 18/05/11 | 19/05/11 | 20/05/11 | 23/05/11 | 24/05/11 | 25/05/11 | 26/05/11 | 27/05/11 | 30/05/11 | 31/05/11 | 01/06/11 | 02/06/11 | 03/06/11 | 06/06/11 | 07/06/11 | 08/06/11 | 09/06/11 | 10/06/11 | 13/06/11 | 14/06/11 | 15/06/11 |
|---|---|---|---|---|---|---|---|---|---|---|---|---|---|---|---|---|---|---|---|---|---|---|---|
| Relative Market Cap performance | |||||||||||||||||||||||
| 1st Week (16 -23 May 2011) | 2nd Week (24th May-30th June 2011) | |||||
|---|---|---|---|---|---|---|
| Opening | Closing | Var(%) | Opening | Var(%) | ||
| 17993.33 | -1.92 | 18011.97 | 18232.06 | 1.22 | ||
|
3,764.36 |
|
0.53 | 3,748.83 | 3,773.20 | 0.65 |
| 304.05 | 304.25 | 0.07 | 302.60 | 302.80 | 0.07 | |
| 389.40 | 383.00 | -1.64 | 383.65 | 411.75 | 7.32 | |
| 1964.25 | 0.31 | 1978.30 | 1938.00 | -2.04 | ||
| 14 |
|---|
| UPCOMING EVENTS |
|---|
| 15 |
|---|


