

Price confirmation: volume can confirm price movements; for example, an increase in price on high volume may indicate strong buying interest, while a decrease on high volume may signal strong selling pressure. this is valuable for technical analysis and risk management.
APT
Student ID:
Contents
7. Hypothesis Testing for Partial Betas: 7
8. OLS Regression for the Entire Dataset: 7
13. White Test (Heteroscedasticity Test): 8
Introduction
Investors and researchers have always been interested in the financial markets for several reasons like Wealth Generation, Capital Allocation, Diversification, Innovation, and Long-term Growth. Various factors like Market Volatility, Globalization, Regulatory Changes, Complexity, and Financial Intermediaries all contribute to the dynamic landscape of investing. The MME=F Index Futures is one of them and in this study, we dive into the world of emerging market investments, specifically with the MME=F, and see how Arbitrage Pricing Theory (APT) models help us understand what influences performance (Pražák, 2020).
Background
Motivation
Secondly, the APT model aligns with modern finance's focus on quantitative and data-driven approaches. Data availability and analysis techniques have grown a lot when compared to before, which is why an approach like this is becoming increasingly relevant. Its flexibility in considering multiple factors allows for in-depth evaluations of forces affecting emerging markets (Juniawan et al., 2023).
In conclusion, this study aims to provide a better understanding of the MSCI Emerging Markets Index Futures (MME=F). It also aims to uncover unique challenges and opportunities that investors face when dealing with it. By applying the Arbitrage Pricing Theory (APT) model we seek to reveal how this critical financial instrument performs (Mandala et al., 2023).
Literature Review
Methodology
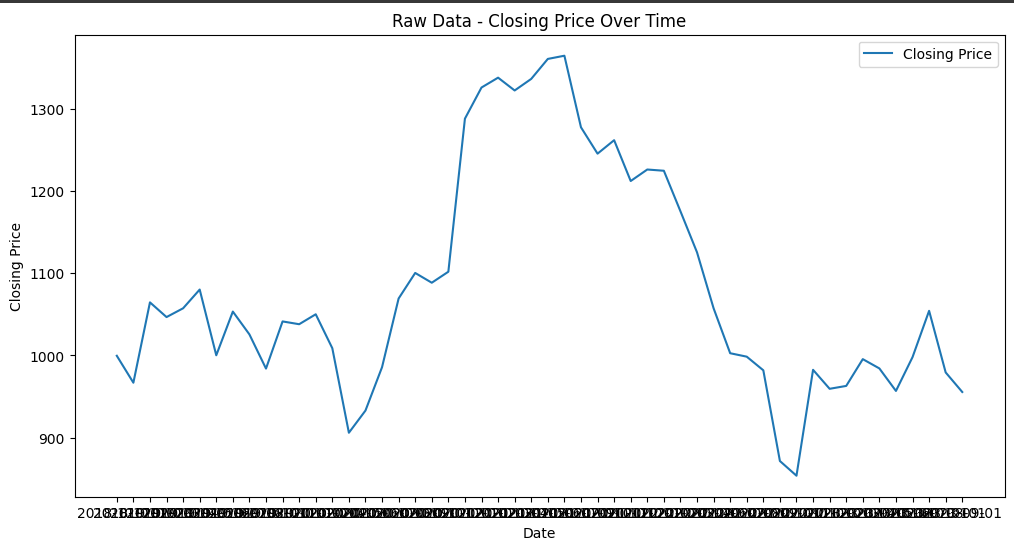
The dataset which we have used for our analysis is the MSCI Emerging Markets Index Futures (MME=F). This dataset contains historical data from the previous 5 years and contains monthly data as well ranging from, November 2018 to September 2023.
The dataset which we have used consists of the following columns:
Date:
Open:
Gap Analysis: Traders analyze the opening price about the prior day's close to identify price gaps, which can offer trading opportunities based on the size and direction of the gap.
Development of Trading Strategy: Both traders and day traders rely extensively on the opening price to create their trading tactics, especially for those who use techniques that are centred on the market's first few seconds.
High:
Low:
Support Levels: Technical analysis uses low prices to detect potential support levels, where buying interest may emerge, preventing further price declines.
Range Evaluation: The range between high and low prices provides a framework for assessing intraday price movements and volatility, which is essential for trading strategies.
Close:
Adj Close:
Dividend Inclusion: So much more is considered in the adjusted closing price. This includes dividends and other corporate actions. This provides someone who’s focused on income with a very detailed outlook of how the asset is doing.
Consistency in Historical Data: It's tough to judge someone's past conduct in the absence of context. The same might be said about stocks; if you are unaware of stock splits or other business operations, it is difficult to understand exactly is occurring there. When looking at past pricing, this helps verify that the data isn't tainted in any manner.
Accurate Valuation: By considering changes in share structure, dividends, and other factors influencing closing price, an investor can get a more accurate look at how a security should be valued.
Volume:
Market Activity: Market activity is something that every investor should keep track of. Especially on specific dates, as this allows them to see if there was any interest in any assets from outside players or if they were all quiet on certain days.
Liquidity Assessment: It’s easy to buy or sell something without affecting its price when there’s a lot of liquidity involved. If everything seems stagnant then an investor might want to wait before doing anything major with their assets.
Price Confirmation: Volume can confirm price movements; for example, an increase in price on high volume may indicate strong buying interest, while a decrease on high volume may signal strong selling pressure. This is valuable for technical analysis and risk management.
Results
Durbin-Watson Statistic: 0.9712
Breusch-Pagan Test Results:
The Breusch-Pagan test does not indicate heteroscedasticity (Njenga, 2023) (if the p-value is more than 0.05), it suggests that the residual of the model does not indicate signs of heteroscedasticity.
Jarque-Bera Test Results:
The Jarque-Bera test reveals that the model's residuals do not follow a normal distribution (Enow, 2023). The low p-value suggests a departure from normality, which can be a concern.
White Test Results:
Chow Statistic: 0.1036
Linear Regression Model:
Methodology
1. Data Preparation:
Import required libraries (pandas, numpy, matplotlib, seaborn, statsmodels, scipy).
Read the financial data from a CSV file (in this case, '/content/MME=F.csv') into a Pandas DataFrame (df).
2. Data Exploration:
3. Data Transformation:
4. Descriptive Statistics:
Visualize the data distribution using a histogram.
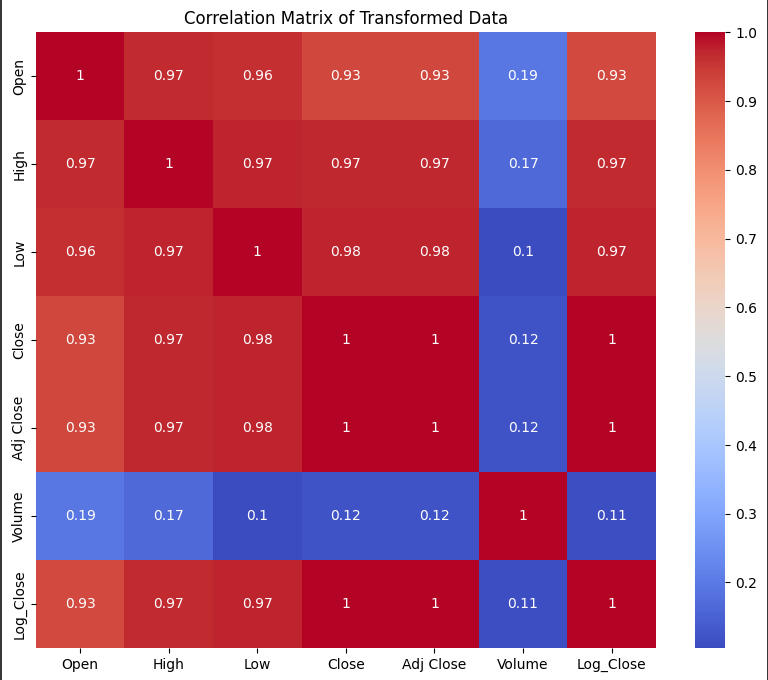
5. Correlation Analysis:
Calculate and visualize the correlation matrix to explore relationships between different variables in the dataset.
6. APT Model Fitting:
Print a summary of the APT model using the Statsmodels library (apt_model.summary()).
7. Hypothesis Testing for Partial Betas:
Perform hypothesis testing to evaluate the statistical significance of each factor's partial beta (Factor 1, Factor 2, Factor 3, Factor 4).
8. OLS Regression for the Entire Dataset:
9. Reset Test (Ramsey Reset Test):
Print the reset test results.
10. Data Type Conversion and Handling Missing Values:
Convert the data types of specific columns to numeric if necessary (e.g., columns containing financial data).
11. Data Splitting and Analysis:
12. Linear Regression for "Before" and "After" Datasets:
Calculate the Chow test statistic to determine whether there's a structural break between the two subsets.
13. White Test (Heteroscedasticity Test):
Conduct the White test to detect heteroscedasticity in the model's residuals.
14. Diagnostic Tests:
15. Interpretation:
Conclusion
To sum things up, this report has taken a deep dive into emerging markets. With a focus on the APT and MME=F here are the main points: Emerging markets are where economies grow quickly, and they offer unique opportunities for investors. The MME=F is like a measuring stick that helps big investors understand how these markets are doing.
APT understood how the MME=F works by using the APT model. While it doesn’t sound pretty, APT takes multiple factors to affect how much money you can make from your investments and gives us a clearer picture of what’s happening in emerging markets.
Recommendations
Reference
Berk, J.B., Binsbergen, J.H. van and Miller, M. (2020). Mutual Funds: Skill and Performance. The Journal of Portfolio Management, 46(5), pp.17–31. doi:https://doi.org/10.3905/jpm.2020.1.143.
Mustafa, K.H. and Ahmed, A.M. (2020). A Critical Review of the Market Efficiency Concept. Shirkah: Journal of Economics and Business, 5(2), p.271. doi:https://doi.org/10.22515/shirkah.v5i2.326.
Nanayakkara, N.S., Nimal, P.D. and Weerakoon, Y.K. (2019). Behavioural Asset Pricing: A Review. dr.lib.sjp.ac.lk. [online] Available at: http://dr.lib.sjp.ac.lk/handle/123456789/10245 [Accessed 23 Oct. 2023].
Appendix
Histogram plot
APT Model
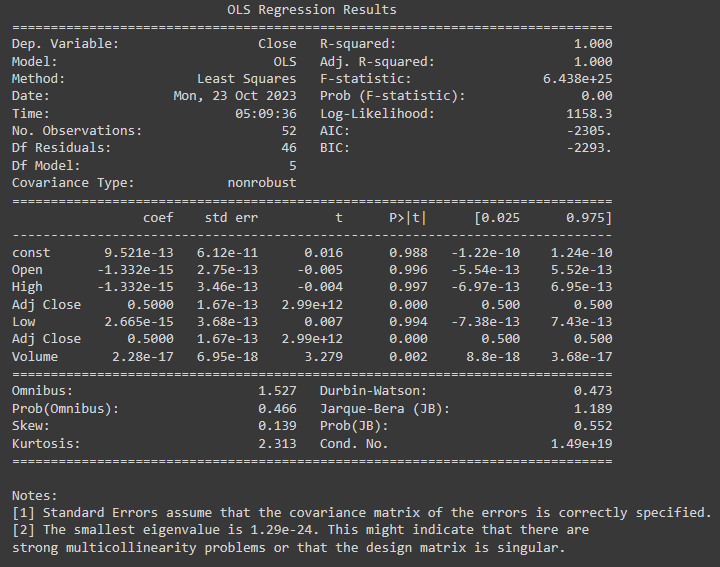
R-squared & Adjusted R-squared

White Test Results:


