
Magnitude and phase responses of high pass, band pass, and band select filters Assignment Answers Needed
Your Question:
Objectives
(a) Design a high pass filter with a passband frequency of 0.5л rad/sample and the stopband frequency of 0.51π rad/sample. Specify 0.1 dB of allowable passband ripple and a stopband attenuation of 60 dB. Plot magnitude and phase responses.
(b) Design a low pass filter with a passband frequency of 0.35 rad/sample and the stopband frequency of 0.65π rad/sample. Specify 1 dB of allowable passband ripple and a stopband attenuation of 60 dB. Plot magnitude and phase responses.
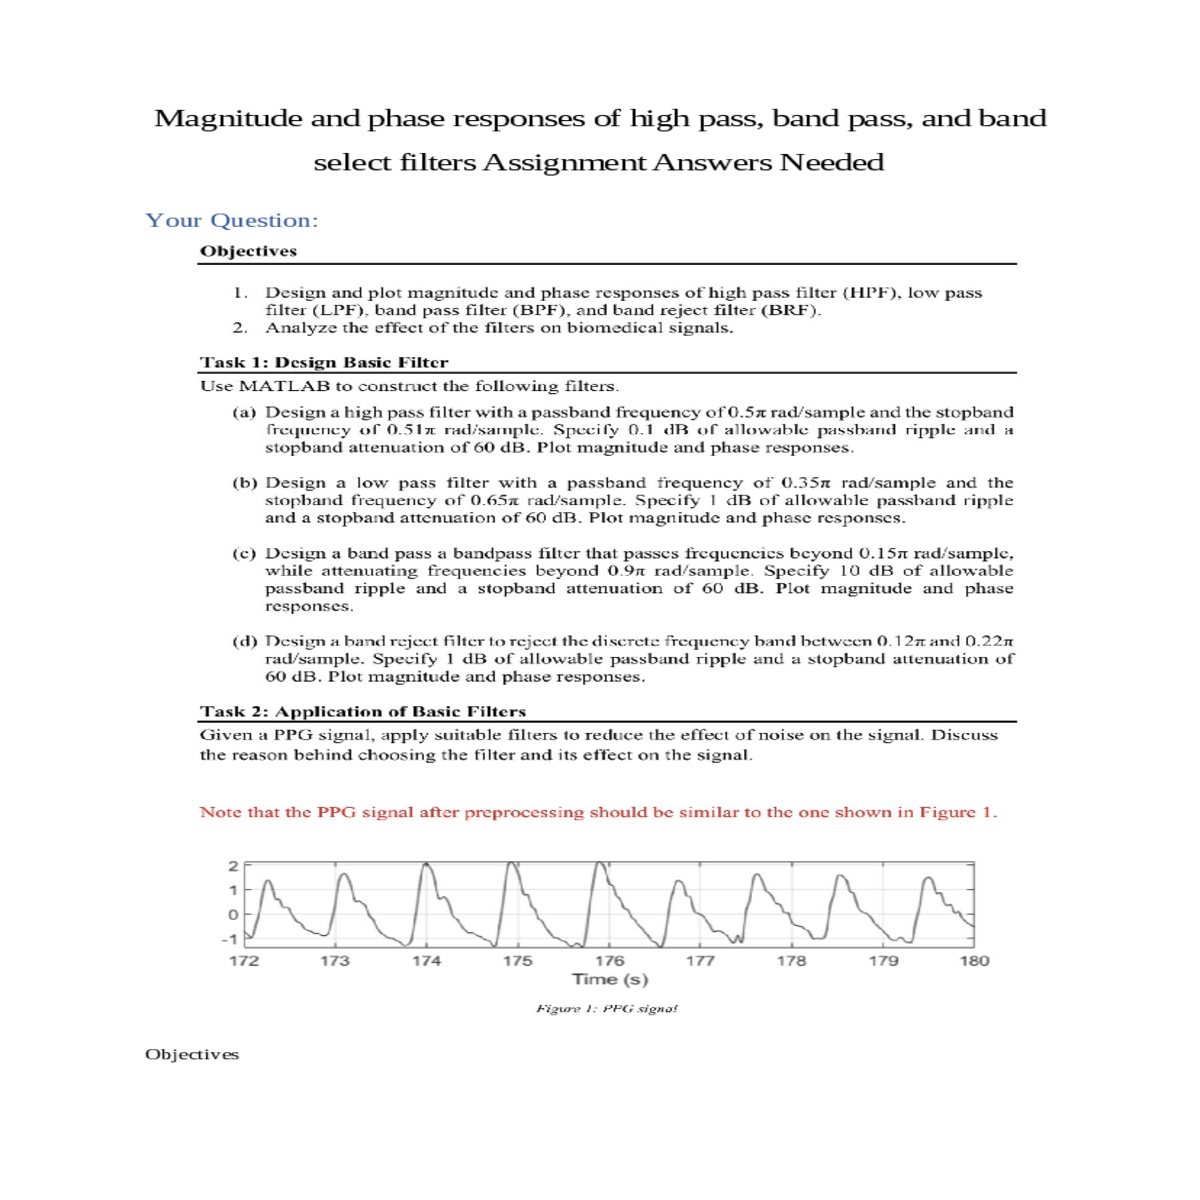
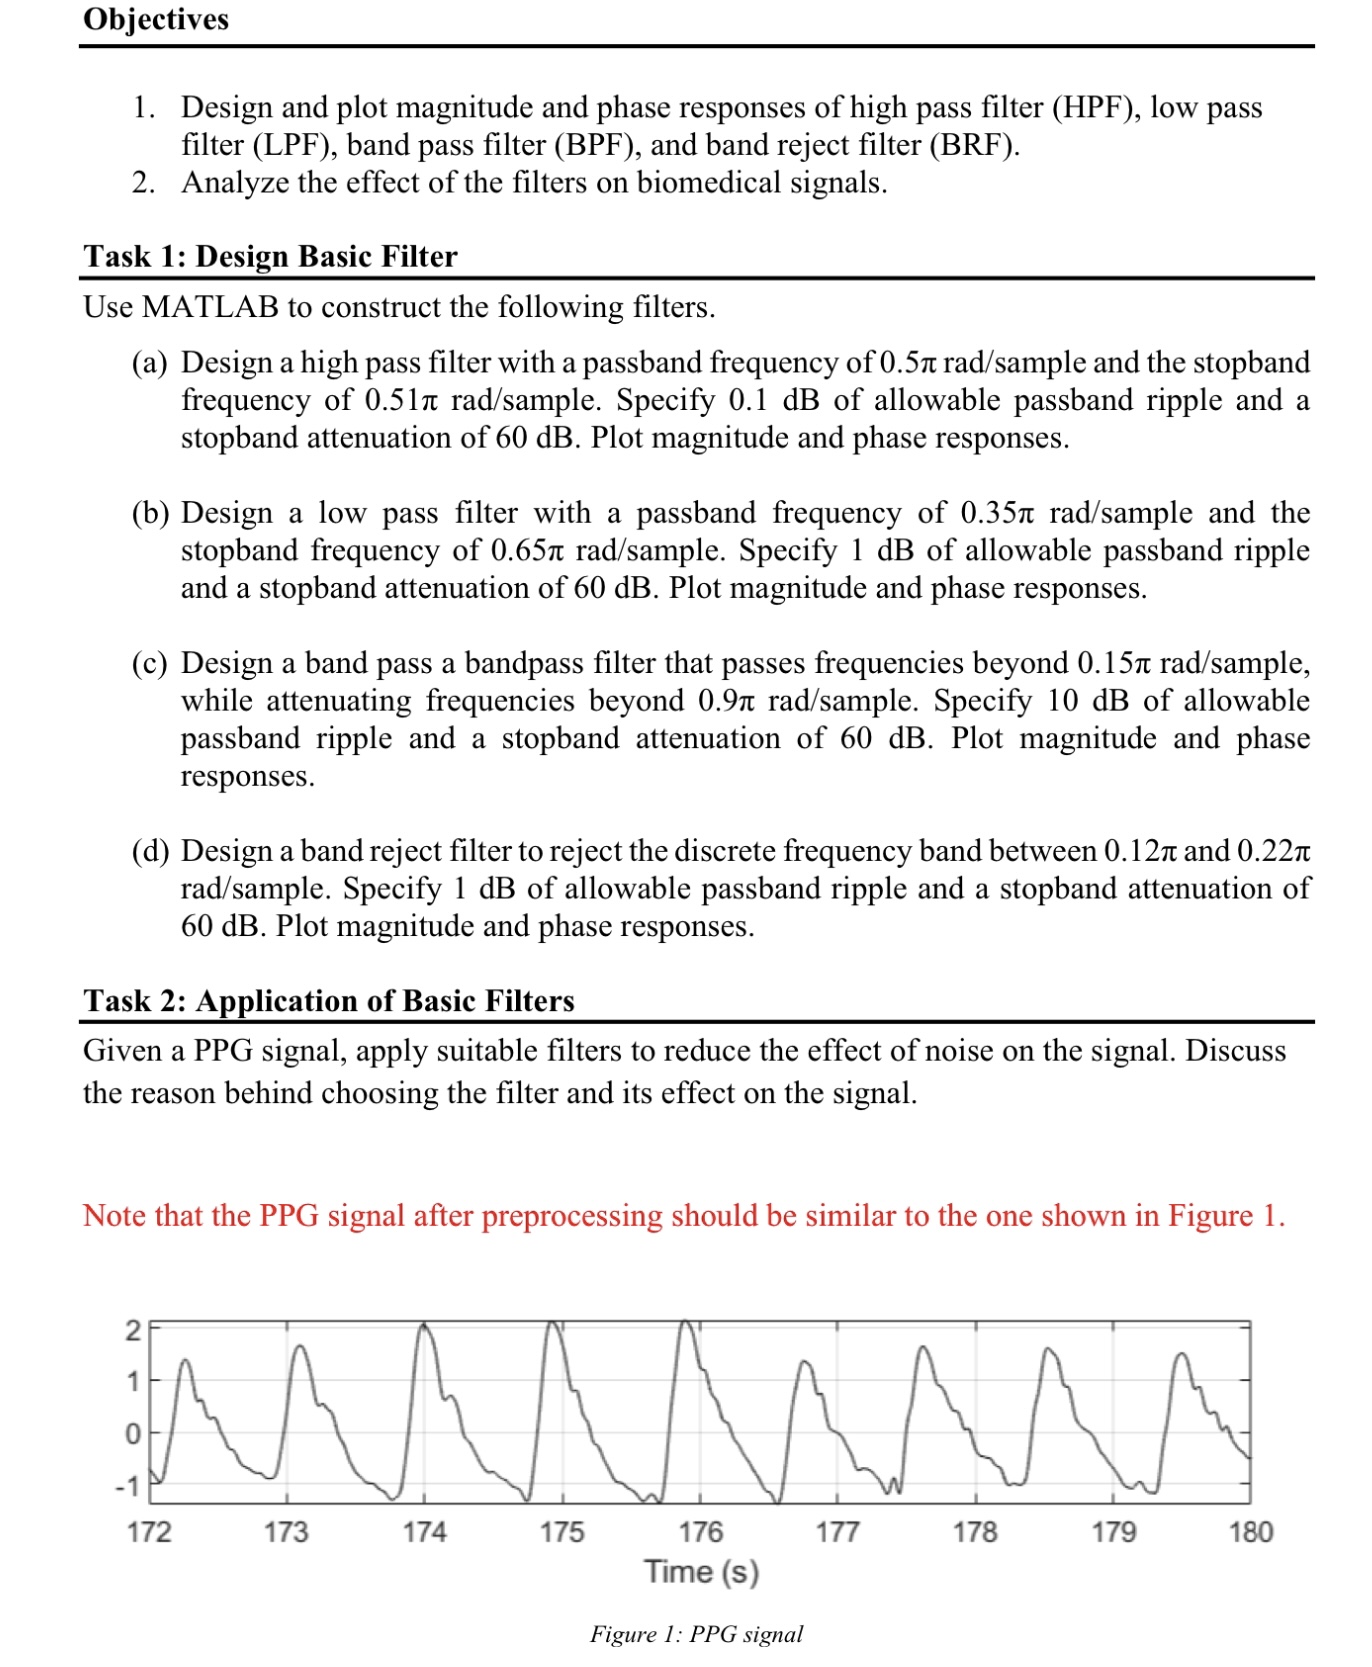
Note that the PPG signal after preprocessing should be similar to the one shown in Figure 1.
0
Step By Step Answers with Explanation
High pass filter
Step 1: Determine the filter specifications
Once we have chosen a filter design method, we can use a filter design tool to design the filter. There are many different filter design tools available, both commercial and open source. For this example, we will use the MATLAB filter design tool.
Step 4: Plot the magnitude and phase responses
A band select filter is a type of band pass filter that passes a specific band of frequencies, while attenuating all other frequencies. To design a band select filter, we can use the same steps as for a band pass filter, but we need to specify the lower and upper passband frequencies of the specific band that we want to pass. In this example, we will design a band select filter to reject the discrete frequency band between 0.12π and 0.22π rad/sample. We will specify 1 dB of allowable passband ripple and a stopband attenuation of 60 dB.
MATLAB code
Fp = 0.5*pi; % Passband frequency
Fst = 0.51*pi; % Stopband frequency
[B, A] = butter(N, Wn);
% Plot the magnitude and phase responses
ylabel('Magnitude (dB)');
% Design a band pass filter
[B, A] = butter(N, Wn);
% Plot the magnitude and phase responses
ylabel('Magnitude (dB)');
% Design a band select filter
[B, A] = butter(N, Wn);
% Plot the magnitude and phase responses
ylabel('Magnitude (dB)');


