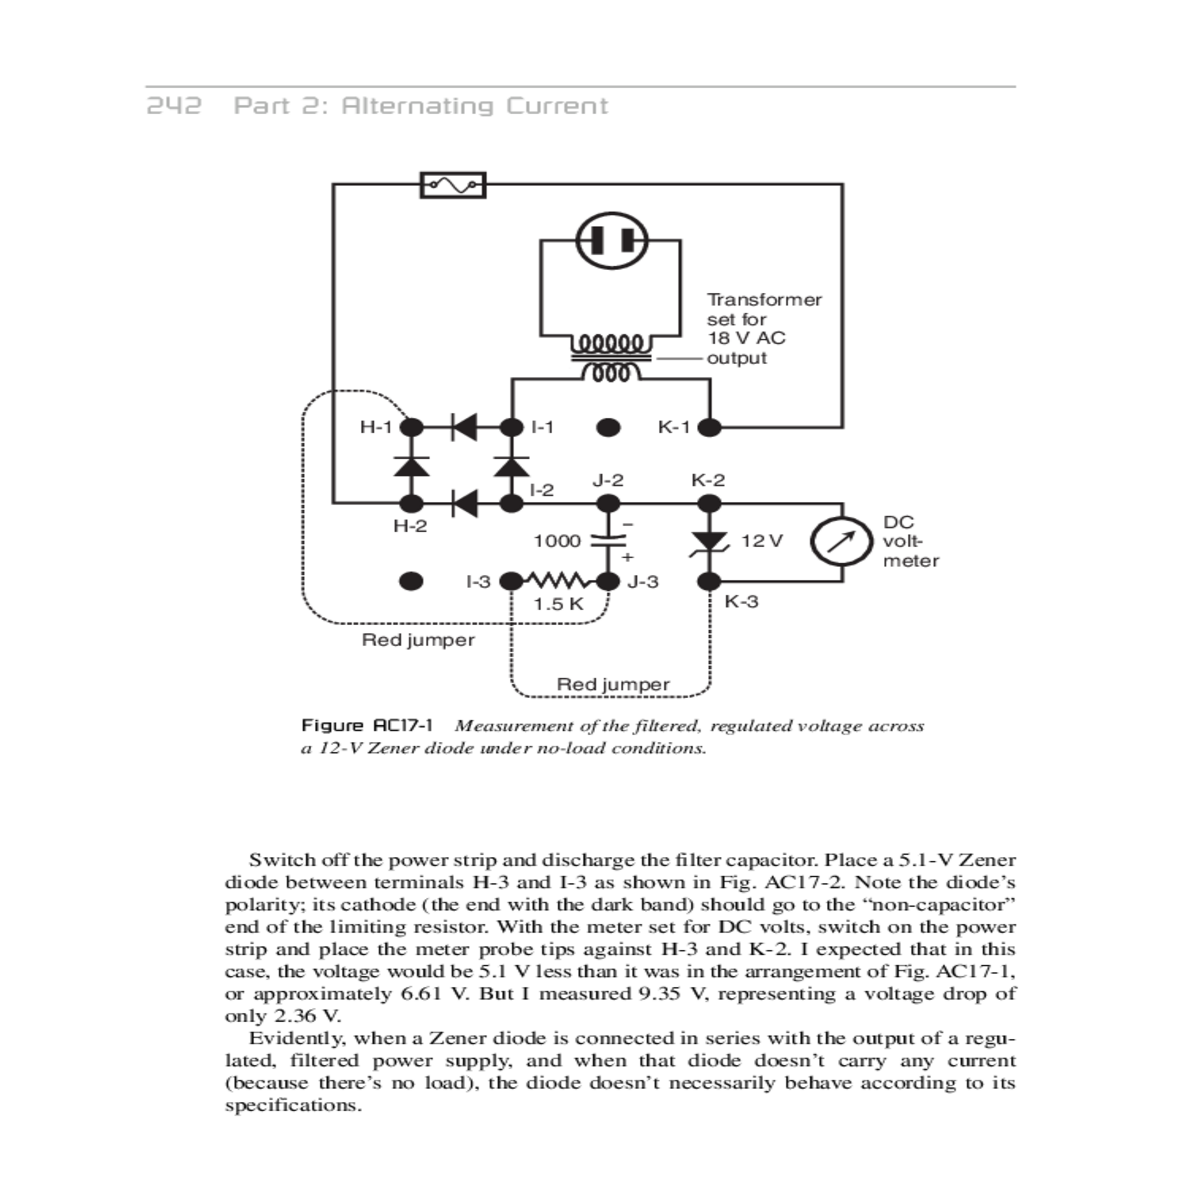

Place zener diode between terminals and shown fig
|
|---|
| H-1 | I-3 | I-1 | K-1 | DC | |
|---|---|---|---|---|---|
| H-2 | I-2 | ||||
|
12 V | ||||
| 1000 | volt- | ||||
| 1.5 K | meter | ||||
|
|||||
| K-3 | |||||
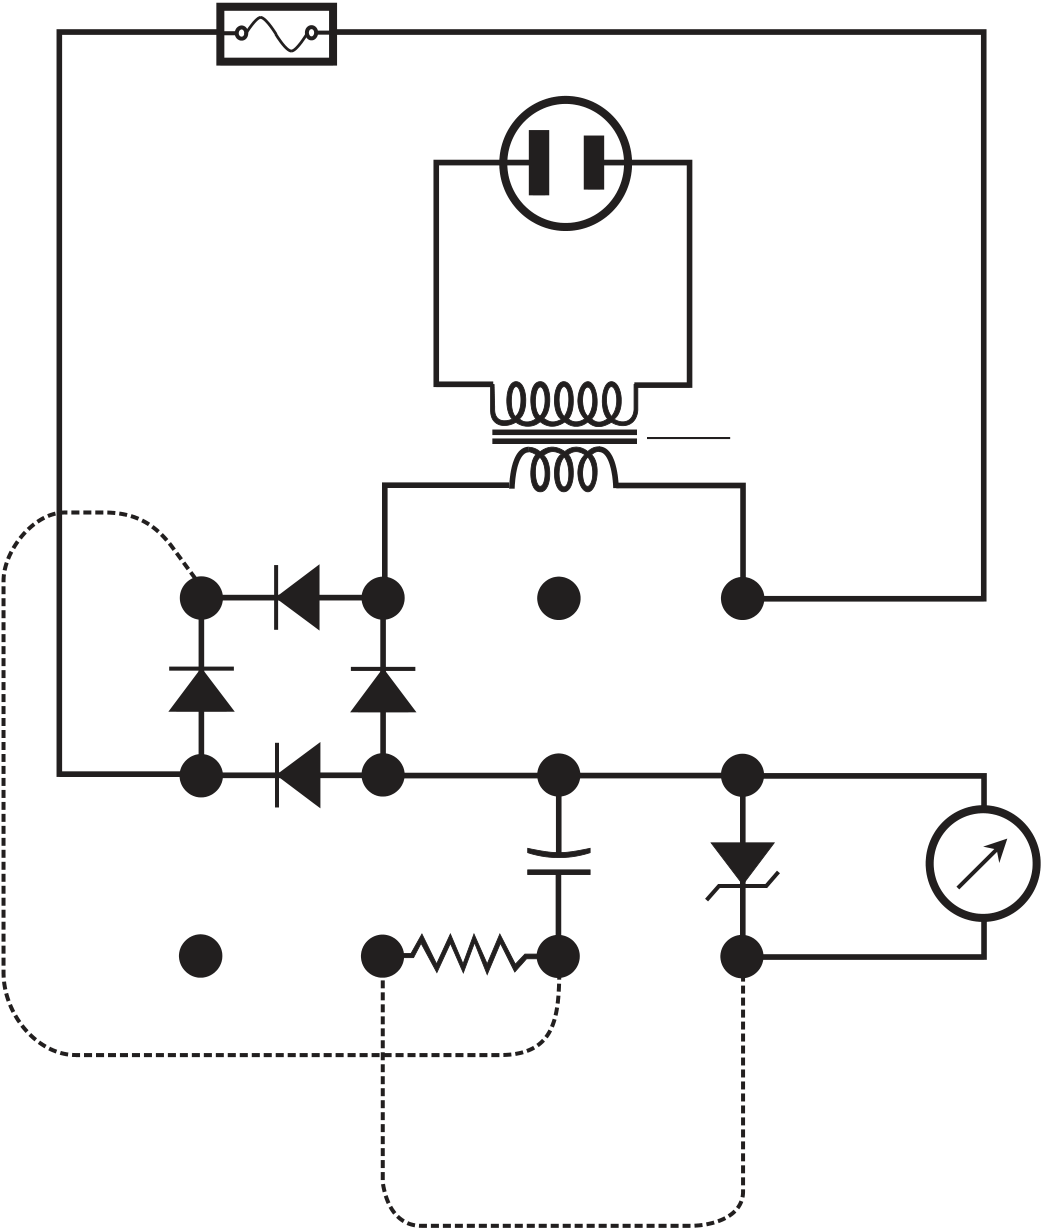
Switch off the power strip and discharge the filter capacitor. Place a 5.1-V Zener diode between terminals H-3 and I-3 as shown in Fig. AC17-2. Note the diode’s polarity; its cathode (the end with the dark band) should go to the “non-capacitor”end of the limiting resistor. With the meter set for DC volts, switch on the power strip and place the meter probe tips against H-3 and K-2. I expected that in this case, the voltage would be 5.1 V less than it was in the arrangement of Fig. AC17-1, or approximately 6.61 V. But I measured 9.35 V, representing a voltage drop of only 2.36 V.
Evidently, when a Zener diode is connected in series with the output of a regu-lated, filtered power supply, and when that diode doesn’t carry any current (because there’s no load), the diode doesn’t necessarily behave according to its specifications.
| AC17: A Zener-Diode Voltage Reducer |
|---|
| H-1 | 5.1 V | I-1 | ||
|---|---|---|---|---|
| H-2 | I-2 | |||
|
|
|||
| 1.5 K | ||||
| H-3 | I-3 | |||
| K-3 | ||||
DC voltmeter
Figure AC17-2 Measurement of the filtered, regulated,


