

Max construct box plot label the axis identify outliers
Math 140
Review I
Fall 2016
PART 1
Multiple choices
1. Which of the following measurements is likely to
have the least variation?
a. The individual weights in ounces of oranges in a randomly selected five-pound bag of oranges at the market.
| b. | |
|---|---|
| c. |
1.Numerical variable b. Categorical variable c. Neither 3. The temperature of a greenhouse at a certain time of the day.
a. Numerical b. Categorical
4. The number of tomatoes harvested each week from a
greenhouse tomato plant.
a. 13% b. 27% c. 33% d. 53%
1
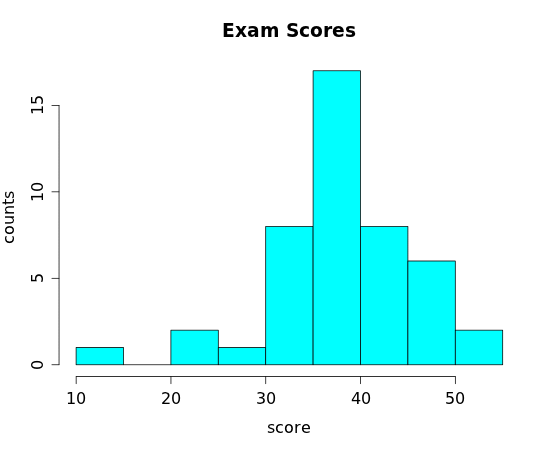
7. In the histogram of exam scores below you can find out :
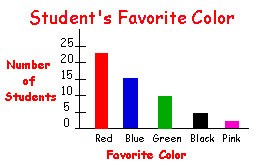
10. The following Bar Graph you can tell :
5
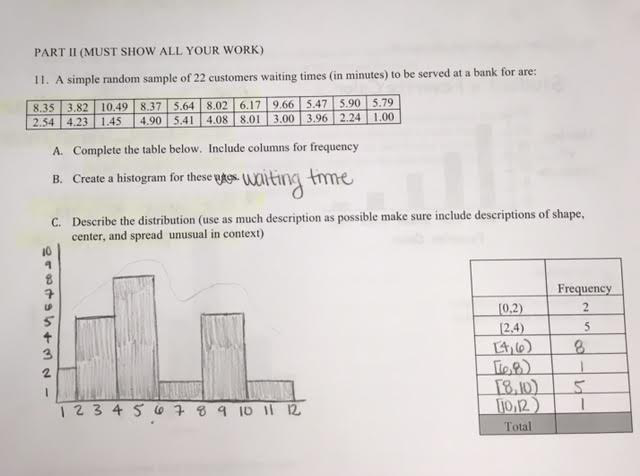
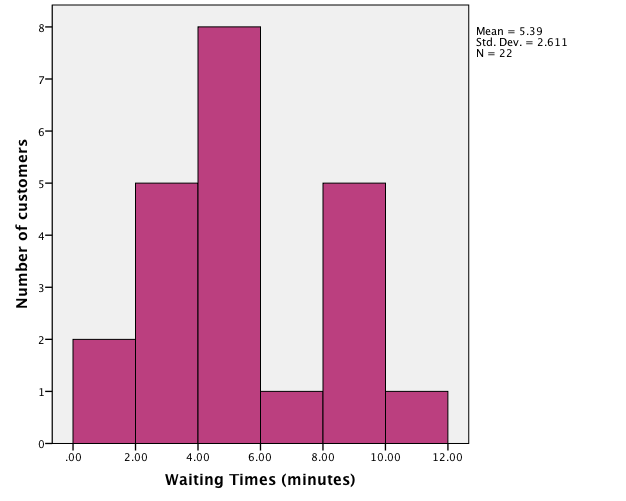
12.
6
|
|
|
|
||||||||||
|---|---|---|---|---|---|---|---|---|---|---|---|---|---|
|
|
|
|
|
|||||||||
|
|
|
|||||||||||
8
16. Given the scatterplot below
a) What is the explanatory Variable? Study times (minutes)
b) What is the response variable? (Quiz Grades)
c) Describe as much as possible the association between time study and
quiz grade from the following scatterplot.
10


