Macular thickness map shows global retinal
thinning
304
Table 2: Optical coherence tomography (OCT) parameters of the
eyes in present series.
Case no
OCT Staging
1
Stage 2 Stage 2
2
Stage 3 Stage 4
3
Stage 4 Stage 4
4
Stage 1 Stage 2
5
Stage 2 Stage 2
* CMT: Central 1 mm subfield macular thickness † MV: Macular volume (from 6 mm fast macular scan protocol)‡ RNFLT:
Retinal nerve fiber layer thickness
On the basis of clinicalfundus and angiographic findings, BCD can be
seen in four different stages.8 In our study we also found nearly
similar spectrum of findings on OCT but OCT staging does not always
corroborate with clinical staging. The left eye of case 2 shows stage 4
OCT findings though clinically seem to be an intermediate stage (Figure
6). Similarly right eye of case 5 shows of light by crystals to this
highly reflective retinal layers. Outer retinal hypo-reflectivity seen
on OCT scan in stage 2 onwards is indicative of photoreceptors loss and
correlates well with histopathological reports in the literature.13 The
atrophy of the retinal layers, RPE and sclerosis of choriocapillaris
results in increased reflectivity from the choroid.
stage 2 OCT findings while clinically looks like early disease
(Figure Due to retinal atrophy and less contrast subtle macular changes
2A-C). are poorly discernable on clinical examination in patients
with
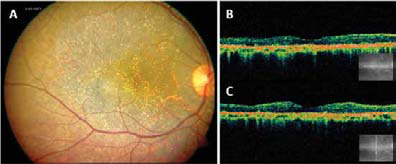
Figure 5: Fundus photographs and OCT
images.5A:Fundus photograph of right eye of
case 3 shows absence of crystals with complete chorioretinal atrophy in
the posterior pole suggesting clinically of end stage BCD.5B, C:Horizontal and vertical 6 mm OCT line scans
of same eye show retinal thinning and foveal atrophy. This extended
hyper-reflectivity from RPE-Bruch’s membrane complex is suggestive of
sclerosis of the choriocapillaris. 2H: Macular thickness map shows
global retinal thinning.
29
www.dosonline.org
You are viewing 1/3rd of the document.Purchase the document to get full access instantly
Purchase the document to get full access instantly