
Lifo and weighted average costing method
Contents
Introduction
This report is about analyzing the financial decision making of organizations in New Zealand by analyzing and interpreting their financial statements and also analyzing the operating environment of Maori/Iwi organizations.. For this report we have chosen two organizations, one is Maori organization named as Moana New Zealand Ltd which was formerly known as Aotearoa fisheries limited and other is Stanford Ltd. Both companies are two of the biggest companies in New Zealand in seafood and fishing industry. Though both companies are involved in seafood production, major difference lies in the value system on which business operates. While Sanford is more economically driven and wants to be world’s best seafood company, Moana New Zealand vision is to maximise Maori fisheries assets value. This difference arises due the difference in principles as Moana follows maori principles which are discussed in the report.
Financial Statement Analysis
Ratio Analysis
| Table 1: Ratio Analysis for Moana New Zealand | |||||
|---|---|---|---|---|---|
| Ratios | 2013 | 2014 | 2015 | 2016 | 2017 |
| 1. Activity Ratio | |||||
| Inventory turnover ratio(Cost of Sales/ Average Inventory) | 14.20 | 15.16 | 14.88 | 16.46 | 16.69 |
| Account Receivables Turnover Ratio (Net Sales/ Average receivables) | 10.34 | 9.66 | 8.97 | 9.00 | 9.24 |
| 2. Liquidity Ratio | |||||
| Quick Ratio ((Cash+Receivables+Marketable securities )/Current Liabilities) | 0.56 | 0.49 | 0.51 | 0.50 | 0.35 |
| 3.Solvency Ratio | |||||
| Debt to Equity Ratio ( Total Liabilities/Total Equity) | 0.24 | 0.29 | 0.28 | 0.28 | 0.24 |
| 4.Profitability Ratio | |||||
| Gross Profit Margin (Gross Profit/Net Sales) | 26.06% | 23.27% | 22.94% | 19.93% | 20.52% |
| Return on Equity (Net Income/Total Equity) | -1.49% | 5.32% | 3.91% | 4.61% | 4.41% |
From the above table, we can make following interpretations:
Inventory turnover ratio has increased from 14.20 to 16.69 from 2013 to 2017 which indicates improvement in inventory management system as it means inventory is getting sold at an increasing rate.
From the above table, it can be concluded that:
Stanford’s working capital management system needs improvement as its efficiency ratios such as Inventory turnover and Accounts receivable turnover declined from 11.63 and 9.24 to 9.41 and 7.99 respectively from 2013 to 2017.
Comparison with industry averages
| Table 3: Ratio Comparison for year 2017 | |||
|---|---|---|---|
| Moana | Sanford | Industry (Sanford Ltd (SAN.NZ) financials, 2018) | |
| Inventory Turnover Ratio | 16.69 | 9.41 | 6.75 |
| Accounts Receivable Ratio | 9.24 | 7.99 | 31.34 |
| Quick Ratio | 0.35 | 0.59 | 1.75 |
| Debt to Equity Ratio | 0.24 | 0.42 | 0.40 |
| Gross Profit Margin | 20.52% | 23.49% | 27.77% |
| Return on Equity | 4.41% | 6.51% | 5.20% |
Ratio Analysis for Year 2017
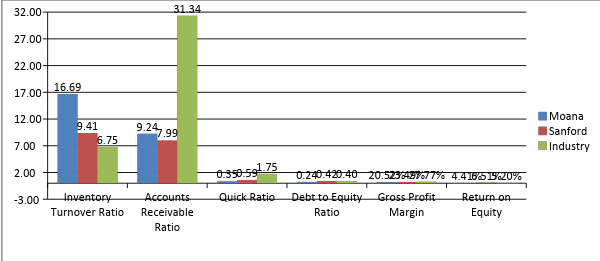
Both companies have stable debt to equity ratio which is in line with industry average which means both companies are less risky and can utilize this in future to strengthen their capital structure.
There is not much and significance difference in profitability ratios which shows Moana needs to increase their profitability where Stanford are providing better returns to their shareholders.
Dividend Ratio
Valuation
| Table 4: For the Year ended 2017 | |||
|---|---|---|---|
| Moana | Sanford | ||
| A. | Cash Flow ($000) | 19363 | 50280 |
| B. | Earnings ($000) | 19260 | 37478 |
| C. | No. Of shares (000) | 250 | 93626.735 |
| D. | CF/share ( A/C) | 77.452 | 0.537026096 |
| E. | EPS ( B/C) | 77.04 | 0.40 |
| Table 5: Valuation Using Comparable Approach | ||
|---|---|---|
| Using P/Cash flow Approach | Using P/E approach | |
| Moana Calculated Share price | 1040.18 | 1162.53 |
| Sanford Calculated Share price | 7.21 | 6.04 |
As we can see in Table 5, Moana’s share value should lie between 1040.18 NZD and 1162.53 NZD as per relative valuation approach whereas Sanford share value is between 6.04 NZD and $7.21 NZD
Current Market price of Sanford share is 7.76 NZD which is greater than its intrinsic value.
Financial Decision Analysis
Inventory Method
There are various methods to value a company’s inventory including FIFO, LIFO and Weighted average costing method. Choice of method has significant impact on company’s liquidity and profitability as various methods result into different ending inventory and Cost of Goods Sold (Herath, 2018).
By analyzing both companies’ financial statements, it was found that both companies use weighted average costing method and state their inventory at net realisable value or cost whichever is lower (Sanford, 2017) (Zealand, 2017).
Receivable Management
Payables Management
Payables management include management of trade payables which includes amount company owes to its vendors. It is also an important component for working capital management as companies needs to analyze their terms of credit to forecast their needs for short term funds.
Both Moana and Stanford recognized trade payables at fair value and then measure them at amortized cost.
Maori/Iwi organizations Environment Analysis
Tikanga: It signifies value system of maori people including priorities, rules and ways of doing business. These values set them apart from other organizations. These values include:
Maori diversity
Spirituality
Generosity, hospitality, care and giving
Accounting standards and Reporting system: Maori organizations compliance requirements are same as of other organizations of New Zealand. Their financial statements are prepared with generally accepted accounting practice (GAAP) and comply with NZ IFRS i.e. New Zealand equivalent to International Financial Reporting Standards.
Therefore it can be concluded that financial considerations for Iwi/ Maori organizations are almost similar except the fact that their decisions are primarily driven by their culture and value system instead of economic considerations as they give more value to sustainability and environmental factors.
References
Nissim, D. &. (2001, March). Ratio analysis and equity valuation: From research to practice. Review of Accounting Studies, 6(1), 109. Retrieved September 15, 2018
Sanford. (2017). Sanford Annual Report 2017. Sanford Limited. Retrieved Setember 17, 2018, from file:///E:/Research%20Pixie/Sanford-2017-Annual-Report.pdf


