

Holap hybrid olap and molap multidimensional olap
Yugoslav Journal of Operations Research
15 (2005), Number 1, 125-145DATA WAREHOUSING AND DATA MINING - A CASE STUDY
Received: August 2004 / Accepted: February 2005
Abstract: This paper shows design and implementation of data warehouse as well as the use of data mining algorithms for the purpose of knowledge discovery as the basic resource of adequate business decision making process. The project is realized for the needs of Student's Service Department of the Faculty of Organizational Sciences (FOS), University of Belgrade, Serbia and Montenegro. This system represents a good base for analysis and predictions in the following time period for the purpose of quality business decision-making by top management.
126 M. Suknović, M. Čupić, M. Martić, D. Krulj / Data Warehousing and Data Mining
It is familiar that the strategic level of decision-making usually does not use business information on a daily basis but instead, cumulative and derivative data from specific time period. Since the problems being solved in strategic decision-making are mostly non-structural, it is necessary in decision-making process to consider the large amounts of data from elapsed period, so that the quality of decision-making is satisfied. Therefore, Data Warehouse and Data Mining concept are imposed as a good base for business decision-making.
The description and thorough explanation of the mentioned phases is to follow:
2.1. Current situation analysis
2.2. Selecting data interesting for analysis, out of existent database
It is truly rare that the entire OLTP database is used for warehouse implementation. More frequent case is choosing the data sub-set which includes all interesting data related to the subject of the analysis. The first step in data filtering is noticing incorrect, wrongly implanted and incomplete data. After such data are located they need to be corrected if possible or eliminated from further analysis.
DTS package is written in Data Transformation Services SQL Server 2000. Package writing is very important in DW implementation because packages can be arranged to function automatically so that DW system users can get fresh and prompted data.


128 M. Suknović, M. Čupić, M. Martić, D. Krulj / Data Warehousing and Data Mining
2.5. Selecting fact table, dimensional tables and appropriate schemas
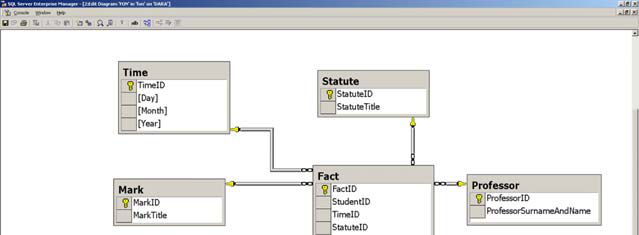
The next step in designing data warehouse is selecting measurements. In this case, two measurements can be seen: total number of passed exams and average mark achieved in passed exams.
In the data warehouse implementation very often appears the need for calculated measurements that are attained from various arithmetic operations with other measurements. Furthermore, this system uses the average that has been calculated as the ratio of the total mark achieved on passed exams and the number of passed exams.
Figure 4: The selection of the optimal percentage of aggregation
130 M. Suknović, M. Čupić, M. Martić, D. Krulj / Data Warehousing and Data Mining
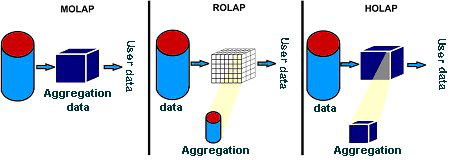
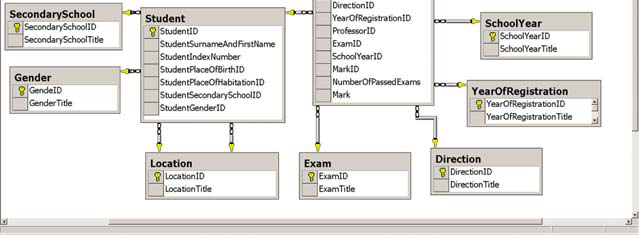
Figure 5: Modes of data storing based on [15].


132 M. Suknović, M. Čupić, M. Martić, D. Krulj / Data Warehousing and Data Mining


3. FROM DATA WAREHOUSE TO DATA MINING
The previous part of the paper elaborates the designing methodology and development of data warehouse on a certain business system. In order to make data warehouse more useful it is necessary to choose adequate data mining algorithms. Those algorithms are described further in the paper for the purpose of describing the procedure of transforming the data into business information i.e. into discovered patterns that improve decision making process.
134 M. Suknović, M. Čupić, M. Martić, D. Krulj / Data Warehousing and Data Mining
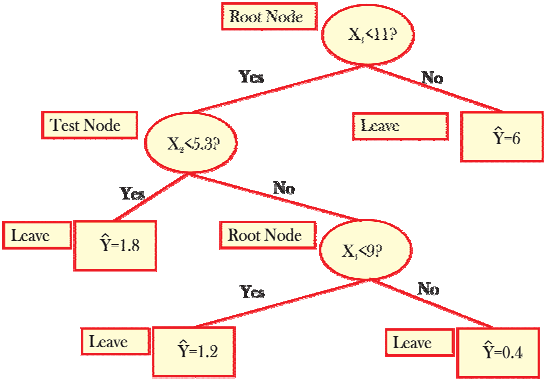
3.1. Regression trees
the terminal nodes, also called leaves.
| variables | 1x and |
|---|
through a chain of logical statements that split the data into four subsets.
Mathematical Formulation
where the functional form f is unknown and there are no assumptions about
the random term tε . Following [14], a regression tree model with k leaves is a
| subregions of some domain | D | ⊂R | m | (3.2.) | |||||
|---|---|---|---|---|---|---|---|---|---|
| ) |
t = 1 |
||||||||
where I j ( x t ) indicates the membership of t observation to the thj leave that
constitute a subregion of D . The functional form of ˆ if is usually taken to be a
3.1.1. CART Regression Tree Approach
The most important reference in regression tree models is the CART
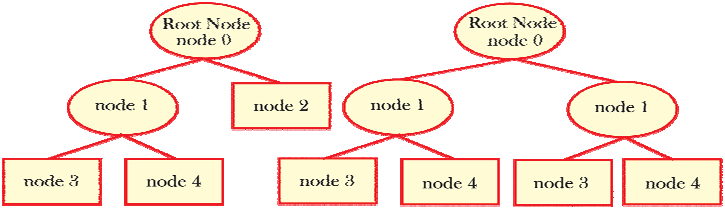
Figure 11: Simplest tree structure based on [7]
To locate the model parameters in the tree structure above, we adopt a labelling
y t = β 01 01 I ( x w c t 0 0 ) + β 02 I 02 ( x w t 0 , c 0 ) + ε t (3.3.)
I 01 (.) = ⎨ ⎧⎪1, fw x 0 t≤c 0 (3.4.)
threshold 0c .
136 M. Suknović, M. Čupić, M. Martić, D. Krulj / Data Warehousing and Data Mining
the recursive partitioning by using hyperplanes that are perpendicular to the predictor
variables’ axis, which means that the vector w is composed of 0 m − zeros and a unity
S = { 1,2,......, m } so that:
⎧⎪1, fx S t 0 ≤c 0
structures are represented in the equations that follow Figure 12:
| ( | j = −left / | j = 2 |
|
|---|
3.1.2. Growing the tree by CART algorithm
estimated for the observations assigned to the generated nodes. This procedure is repeated recursively in the created nodes until it reaches a point where there is no gain in partitioning the observed data. The final model can be evaluated through cost-complexity measures and re-specified by cutting some branches of the tree. This cycle starts with the specification of the simplest model (Fig 9) by selecting a splitting variable Sx0 and a
threshold 0c and estimating the parameters β01 and β02 .The selection and estimation procedures are carried out simultaneously by searching exhaustively the pair ( S c 0 ,0 ) that
estimates of β and 11 β12 are found by selecting the pair ( S c 1 ,1 ) that minimizes the
overall sum of squared errors conditionally on S , 0 0c and β02 . The
138 M. Suknović, M. Čupić, M. Martić, D. Krulj / Data Warehousing and Data Mining

More than one hundred cluster models and decision tree models have been implemented in this project. For the sake of being practical this project will present only some representative examples. In implementation we used Microsoft Decision Trees (MDT) which is based on CART algorithm [17] described in the paragraph 3.1.
M. Suknović, M. Čupić, M. Martić, D. Krulj / Data Warehousing and Data Mining 139


Figure 15: MDT for evaluation of marks
Based on the decision tree the following can be concluded: students that take exam in less number of attempts get better marks and students from the first and the second year of studies (Common Bases Department CB) get worse marks than students from the third and the forth year.


Table 1: Interval's limits of time of studying [13]
Accordingly, out of the total number of observed students, 1672 students or 29.45% belong to the first interval, 1495 students or 27.06% belong to the second, 1248 students or 22.59% belong to the third, 1152 students or 20.858% belong to the forth and 2 students and 0.04% belong to the fifth interval. Two students that have wrongly inscribed data, belong to the fifth interval.
Figure 18: Analysis of dependence between criterions according to evaluation of time of studying based on [18]
142 M. Suknović, M. Čupić, M. Martić, D. Krulj / Data Warehousing and Data Mining
| Cluster No. | Avg Mark | Number of student | Max Avg | ||
|---|---|---|---|---|---|
|
1 | Without pass exams | 1176 | ------ | ------ |
|
2 | 6.54 | 1760 | 6.000 | 7.093 |
| 3 | 7.32 | 1140 | 7.095 | 7.556 | |
| Very good | 4 | 7.77 | 1080 | 7.558 | 8.000 |
| 5 | 8.89 | 1121 | 8.023 | 10.000 |
Table 3: The results of clustering by time of studying for bachelor students based on [18]
The result of this clustering comprises four categories. The first category consists of the students with the shortest length of studies. The average is 4.67 years, while the total number of those students, from the interval of average length of studies from 4.03 to 5.30 years, is 84 or 25.15%. The second category comprises students with average length of studies of 5.69 years, within the interval from 5.31 to 6.09 years, while the total number of them is 83 or 24.85%, etc. It has to be noted that the observed data refer to bachelor students during the period of not more than 10 years, so the interval of the last category is from 6.80 years to, approximately 10 years.
4. IMPLEMENTATION
MDT is based on possibility of various attributes and it is used when prediction of cases is necessary. MDT algorithm also generates rules. Every tie in the tree can be expressed as a set of rules that describes it, as ties that led to it. Besides, these clusters are based on statistic of various attributes. They provide for the creation of the model that is not used for predictions but a very efficient one in finding records that have common attributes so that they can be put in the same group.
MDT enable the user to analyze a great number of various DM problems, with the aim of timely prediction. Using good elements, which follow the prediction, it is possible to make good business plans and lead business system to the benchmark. It can be said with pleasure that this method of analysis of data and making-decision process becomes more and more popular in solving new problems.
|
|
|
|---|---|---|
|
|
|
|
|
|
|
|
|
|
|
|
|
|
|
6. CONCLUSION
This paper shows the phases through which a DW and DM solution is formed. Based on the demonstration we can conclude that DW offers a flexible solution to the user, who can use tools, like Excel, with user-defined queries to explore the database more efficiently in comparison to all other tools from the OLTP environment.
[3]Bhavani, T., Data Mining: Technologies, Techniques, Tools and Trends, 1999.
[4]Birkes, D., and Dodge, Y., Alternative Methods of Regression. John Wiley & Sons, 1993. [5]Breiman, L., and Meisel, W.S., “General estimates of the intrinsic variability of data in nonlinear regression models”, Journal of the American Statistical Association,71 (1976) 301-307.


