

Hint start drawing many isomers you can ppm ppm ppm ppm ppm part


Chem 112A, NMR Worksheet #3 Name____________________________ Due Tuesday, Nov. 15 at 5 pm in GSI mailboxes.
 |
 |
|---|
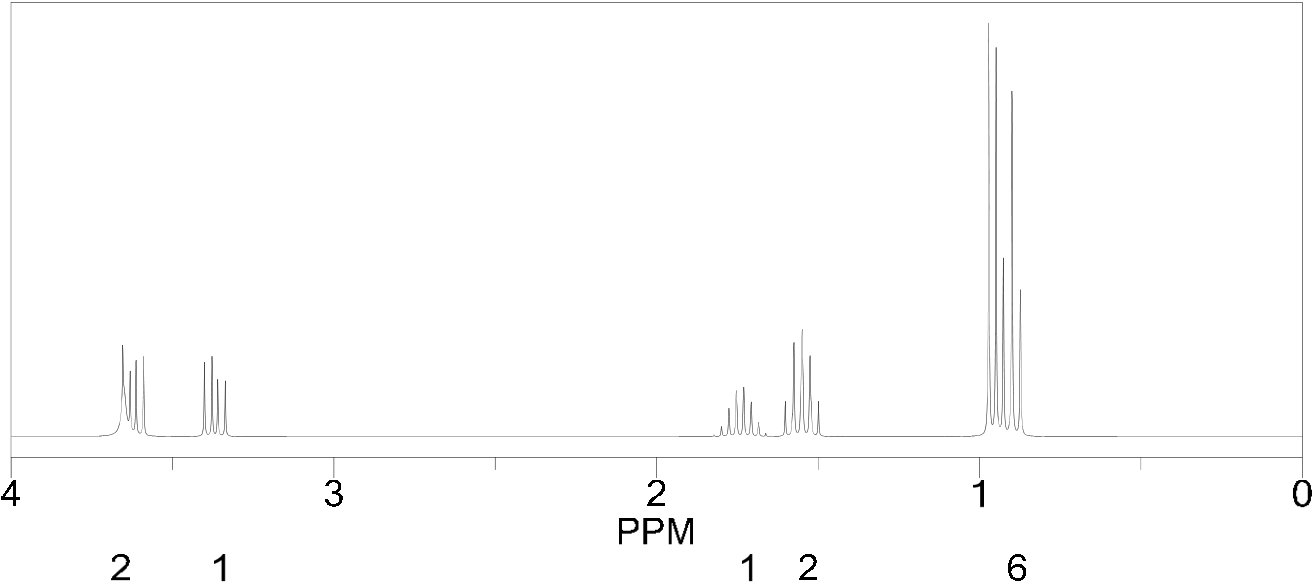
| 1 | 1 | 3 | ||||||||
|---|---|---|---|---|---|---|---|---|---|---|
| 1 | PPM | 2 | 6 |
|
||||||
| 1 | PPM | 2 | ||||||||
|
||||||||||
| 1 | PPM | 9 | ||||||||


1 PPM
22 3
1PPM
22 3
1PPM
29 1 0
9 1 0


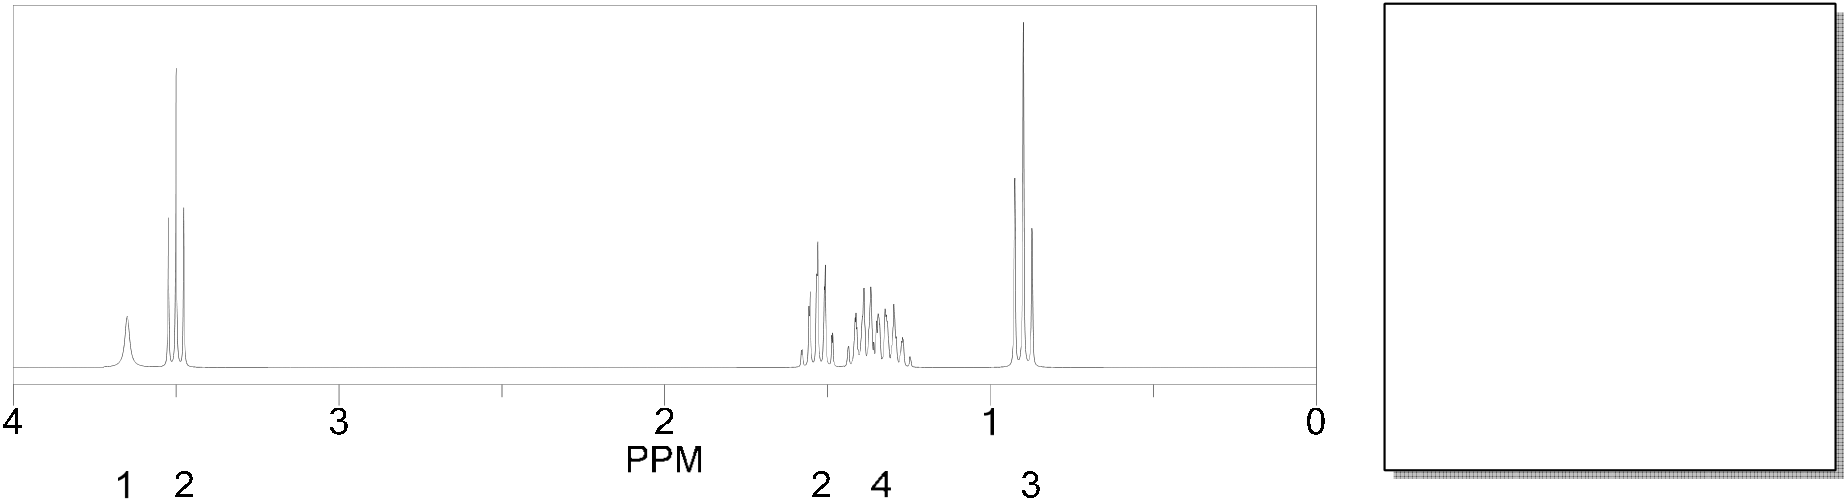
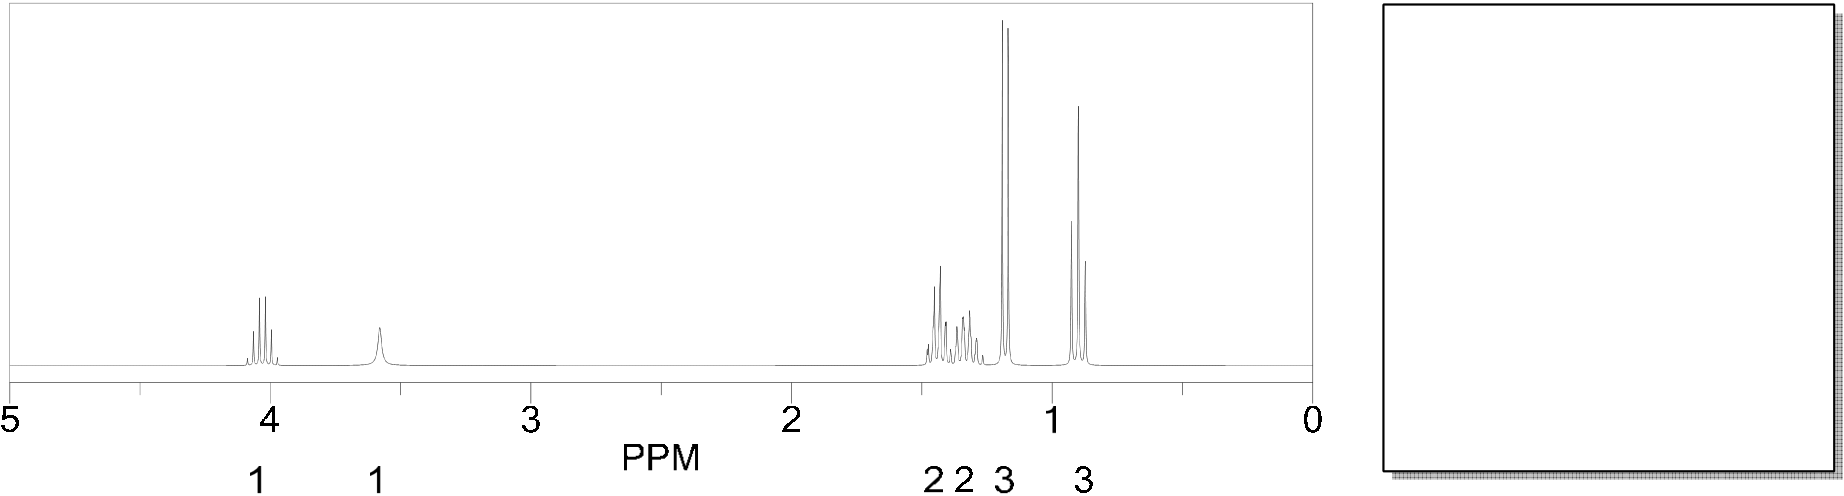
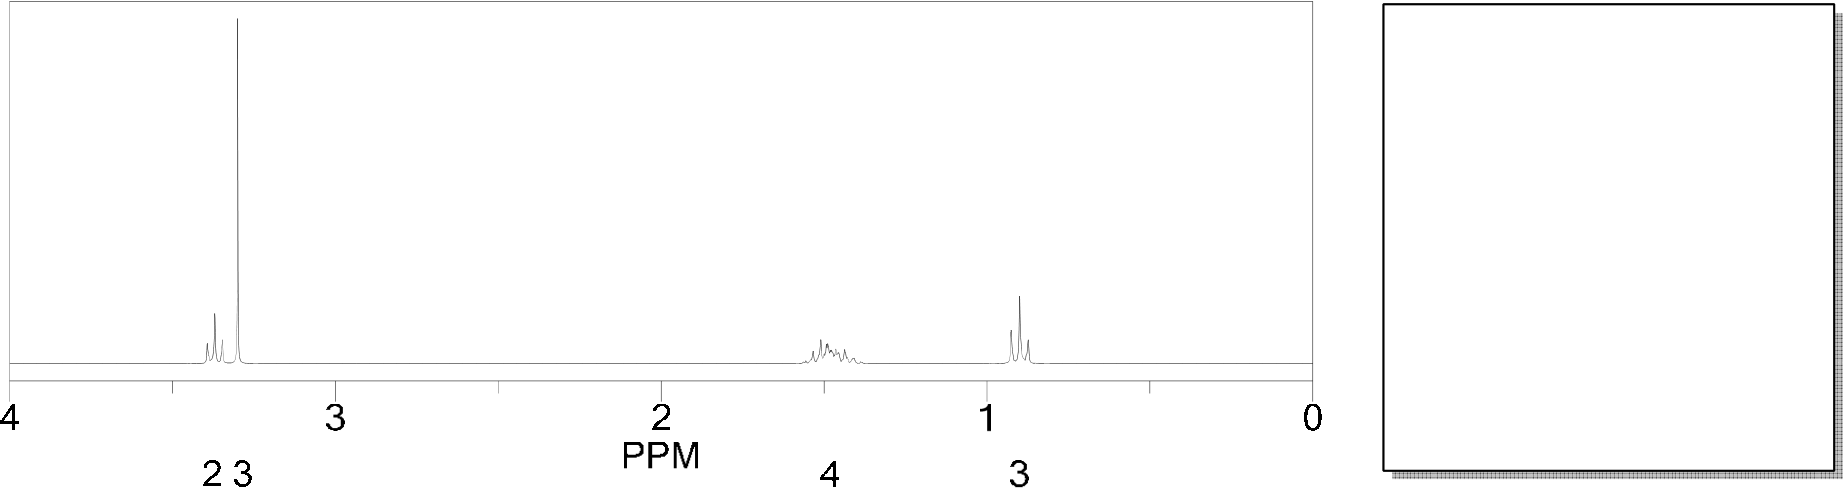
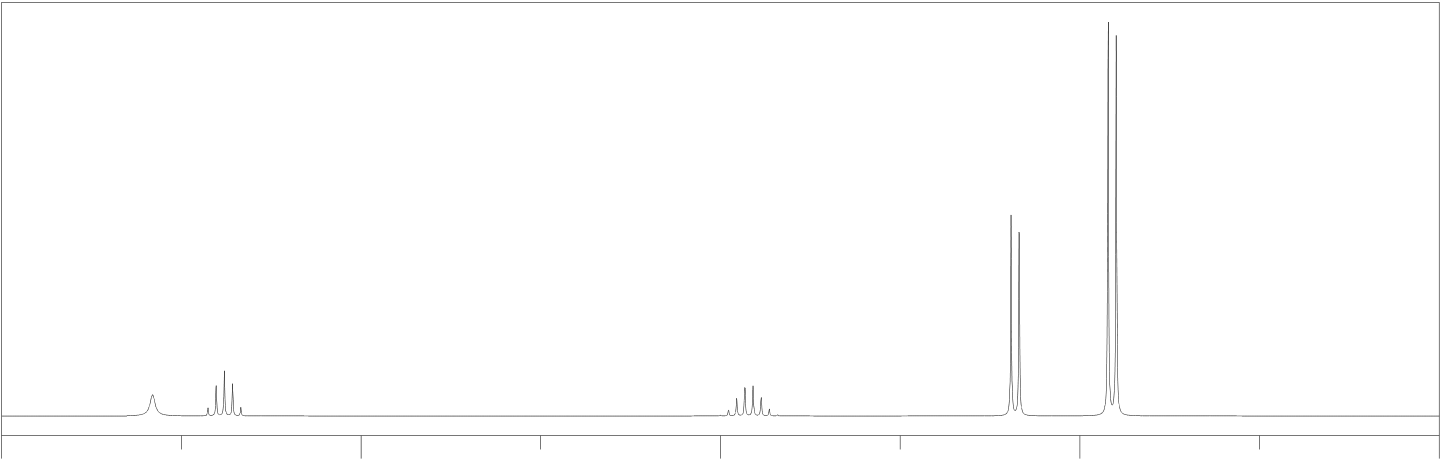
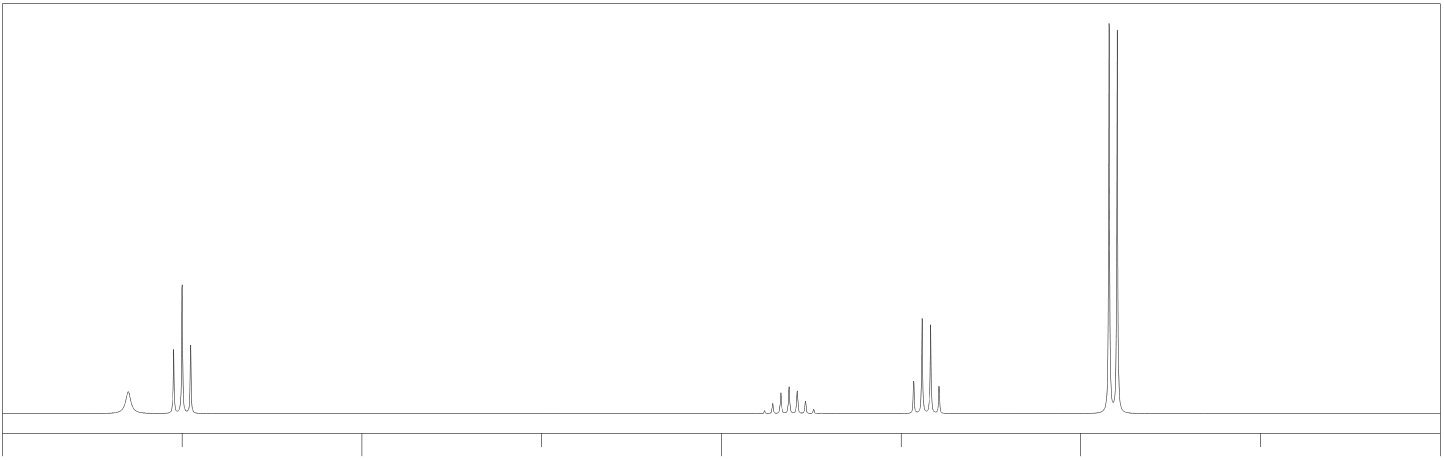
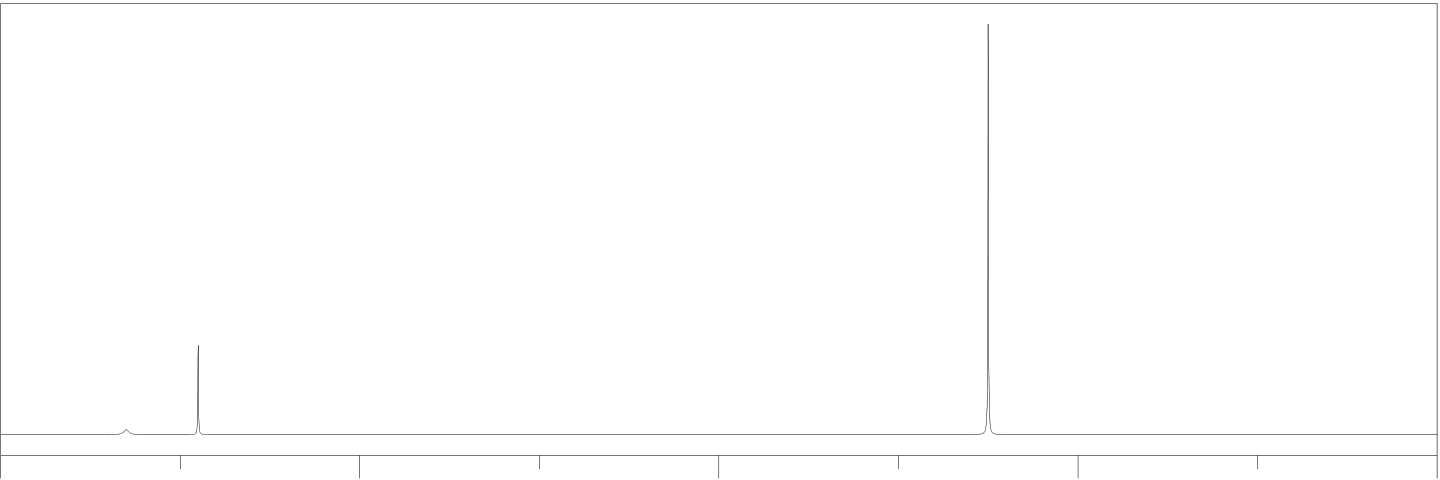
Part 2. A folder has been posted on BSpace containing the raw NMR data sets for both 1H and 13C NMR spectra of five different alcohols with the molecular formula C5H12O.
4.Zoom in on the region from approximately 4.2 ppm to -0.2 ppm. Adjust the height of the peaks to fit the full height of the window.
5.Integrate each of the peaks (except the TMS peak). Make sure that the integrals values are whole numbers, and that they add up to 12 (based on the known molecular formula). By default, the first integral you define is set to an area of 1.0. You can adjust the value of any integral by hovering the mouse over the line showing the integral limits, right clicking, and selecting “edit integral”. Type the value you want displayed in the box labeled “normalized”. The computer will automatically scale the remaining integrals to match. If there are any minor impurities, delete the integral values for those peaks.
9.Locate the TMS peak, calibrate it to zero.
10.Zoom in on the region of the spectrum containing the peaks, and print it out, and make sure that there is a title showing which file it is.


