

Gender script collect the information the population the basis their jobs sum
Report on research question
Part-1 Data Dashboard
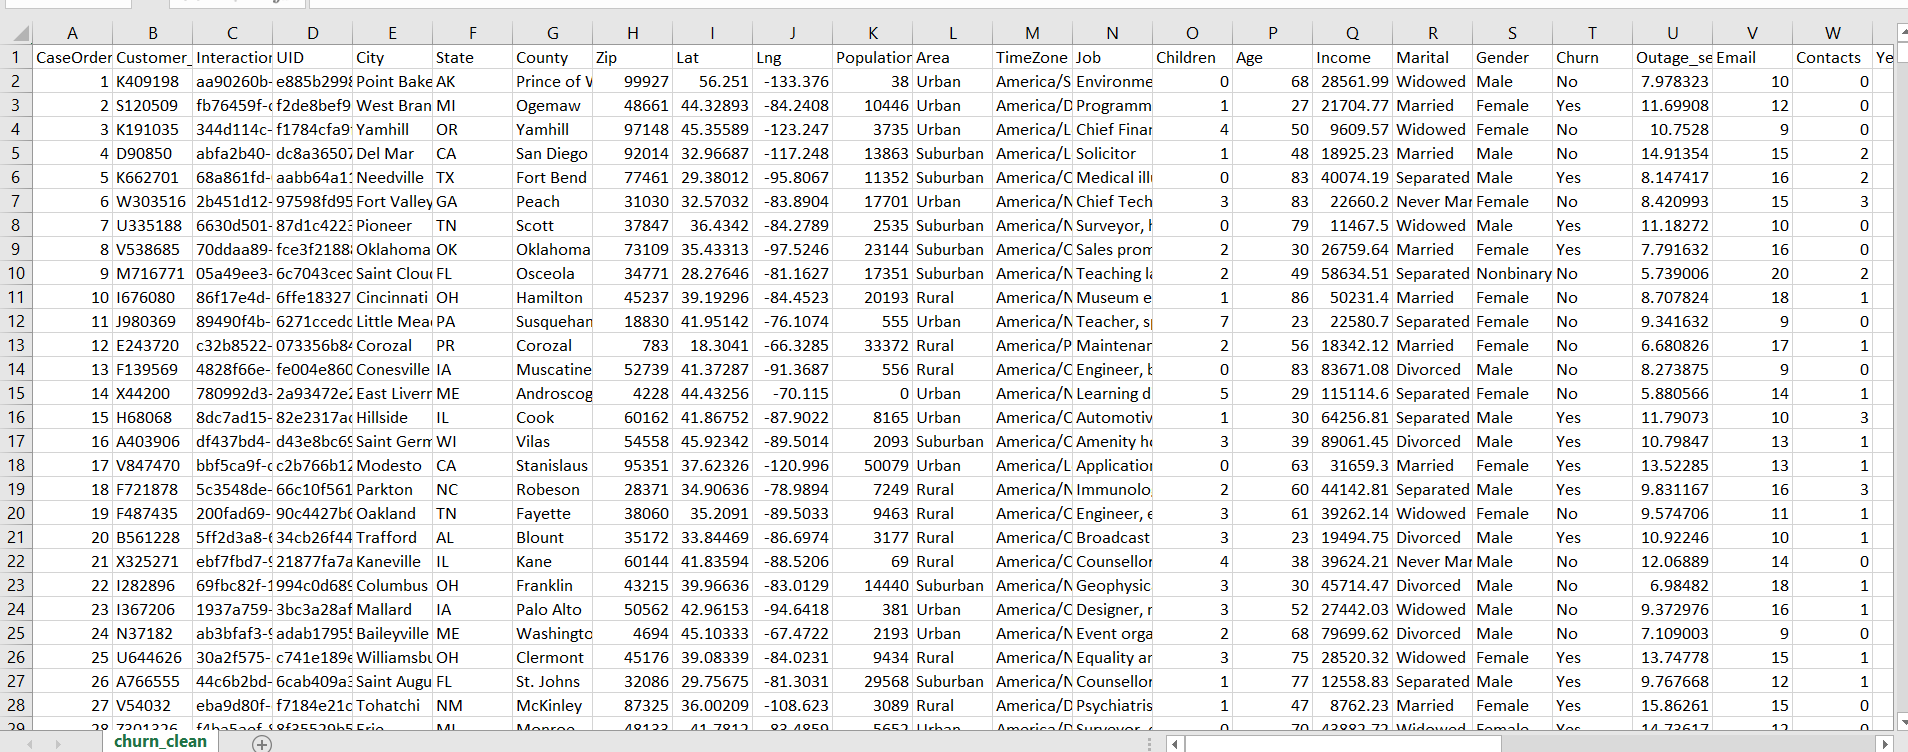
2nd Dataset
Instruction for installing dashboard-
For installing dashboard, we are using tableau business intelligence tool, where we can visualize the dashboard.
For navigating the dashboard, we will have to require the tableau file or we can load the tableau file on the tableau server from which we can view the dashboard.
SQL code required for the dashboard-
select sum(population) as total_population, county from churn_clean group by county order by County asc;
select sum (Bandwidth_gb_year), County from churn_clean group by County order by county asc;
SQL Scripts-
First script collects the information about the income on the basis of area and gender.
select sum(population) as total_population, county from churn_clean group by county order by County asc;
Fourth script contain the information about the bandwidth speed of all country.
Dataset in sql database contain a different data type which need require to change, in this case the tableau is very helpful to make the changes in data type of the data.
Demonstrate how the database were created
Business tool-
Here we are using tableau tool which is most popular tool for visualizing the data & creating the dashboard.
Then we will connect the data to the tableau using sql database connector.
Now we will create the report from the fetched dataset
The churn_clean dataset contains the low size data, where we cannot analyse everything, so for better analysis we have to prefer enough size dataset with useful data, so that we could analyse the dataset perfectly. Here I’m mentioning some limitation of the analysis-
The data low size


