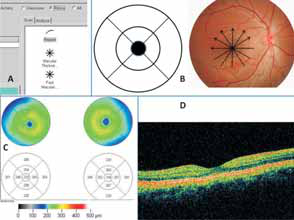
Figure false color coded thickness maps
644
(c) Vitreomacular traction syndromes: It allows the accurate diagnosis and monitoring progression of VMT. It has become invaluable in determining the need for and timing of surgical intervention (Fig. 9)
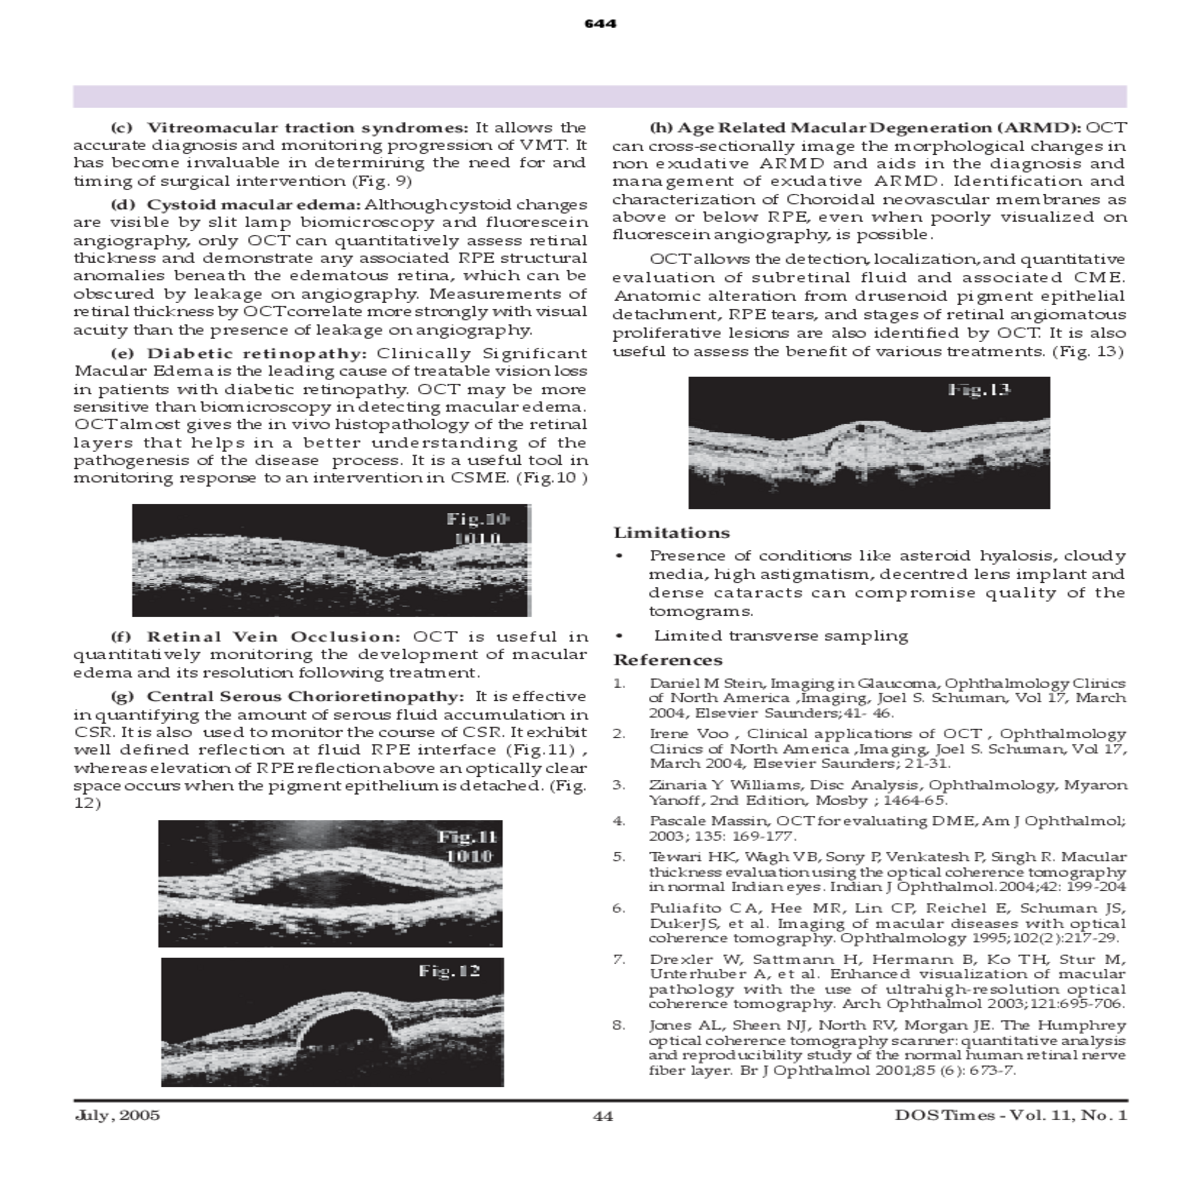
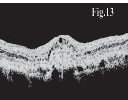
OCT allows the detection, localization, and quantitative evaluation of subretinal fluid and associated CME. Anatomic alteration from drusenoid pigment epithelial detachment, RPE tears, and stages of retinal angiomatous proliferative lesions are also identified by OCT. It is also useful to assess the benefit of various treatments. (Fig. 13)
| • |
|---|
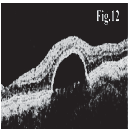
(g) Central Serous Chorioretinopathy: It is effective in quantifying the amount of serous fluid accumulation in
References
1. Daniel M Stein, Imaging in Glaucoma, Ophthalmology Clinics of North America ,Imaging, Joel S. Schuman, Vol 17, March 2004, Elsevier Saunders;41- 46.
| 2. |
|---|
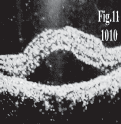
| space occurs when the pigment epithelium is detached. (Fig. | 3. |
|
|---|---|---|
|
4. | |
| Pascale Massin, OCT for evaluating DME, Am J Ophthalmol; | ||
 |
||
| 5. | ||
| Tewari HK, Wagh VB, Sony P, Venkatesh P, Singh R. Macular | ||
| 6. | ||
| in normal Indian eyes. Indian J Ophthalmol.2004;42: 199-204 | ||
| Puliafito CA, Hee MR, Lin CP, Reichel E, Schuman JS, | ||
| DukerJS, et al. Imaging of macular diseases with optical | ||
| coherence tomography. Ophthalmology 1995;102(2):217-29. | ||
 |
7. | Drexler W, Sattmann H, Hermann B, Ko TH, Stur M, |
| 8. | Unterhuber A, et al. Enhanced visualization of macular | |
| pathology with the use of ultrahigh-resolution optical | ||
| coherence tomography. Arch Ophthalmol 2003;121:695-706. | ||
| Jones AL, Sheen NJ, North RV, Morgan JE. The Humphrey | ||
| optical coherence tomography scanner: quantitative analysis | ||
|
||
|
DOS Times - Vol. 11, No. 1 |
| Retina |
|---|
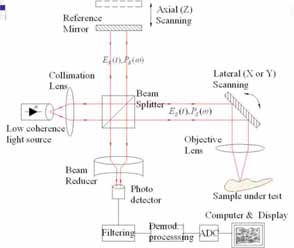
O The thought was followed by introduction of the optical coherence waves instead of sound waves for scanning ocular structures”rgan of vision offers excellent visibility. “Why not use light
tomography (OCT), a technique already used in different specialities of medicine, including ophthalmology. While imaging of other body tissues required endoscopy to deliver light, the clear media of the eye has lent itself to noncontact, non-invasive imaging by OCT. A first two-dimensional in vivo depiction of a human eye fundus along a horizontal meridian based on white light interferometric depth scans was presented at the ICO-15 SAT conference in 1990.1 First in vivo, OCT images, displaying retinal structures, were published in 1993.2
Scanning activities commonly required for evaluation of Vitreo-retinal interface are Macular Thickness Map (MTM), Fast Macular Thickness Map (FMTM) and Line Scans. Both MTM and FMTM use 6 consecutive macular scans, 6 mm in length, centered on the fovea, at equally spaced angular orientations. (Figure 2A & 2B).The 6 OCT images are segmented to detect the retinal thickness, which
|
|
||||
|---|---|---|---|---|---|
| *DRS Northex Eye Institute, Rohini, Delhi | |||||
|