

Each svm was trained database approximately positive and negative grey scale images
138 Petersson, Fletcher, Barnes & Zelinsky
Figure 15. (a) Left image, (b) disparity map, (c) v-disparity image, (d) segmentation
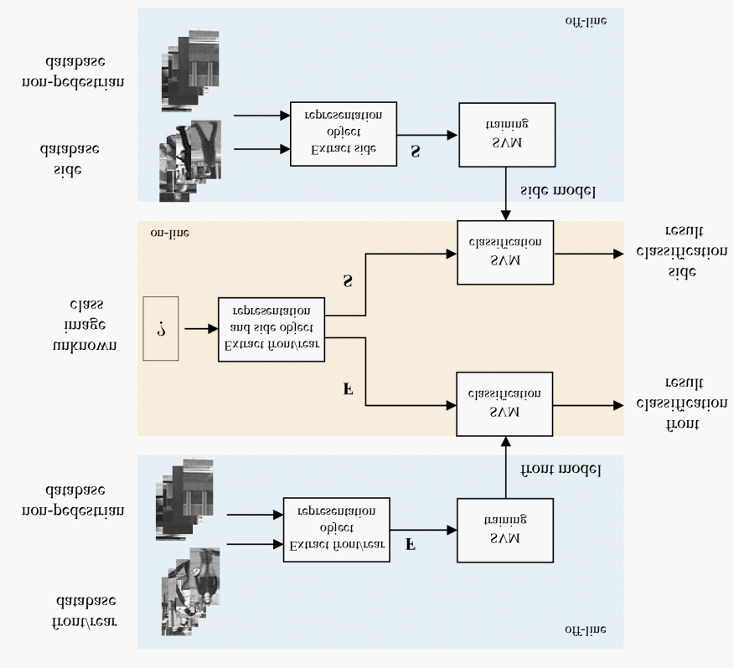
Figure 17 summarises the process of off-line SVM training and on-line SVM segment classification. Each SVM was trained on a database of approximately 1,500 positive and 20,000 negative grey scale images. Using an out-of-sample test image database (150 positive, 2000 negative images), our SVMs were capable of approximately 75% positive detection and 2% false detection.
Pedestrian Tracking
Both obstacle detection and classification generally provide robust
results. How-ever, the results can be incorrect, with obstacle
localisation results being noisy and
Copyright © 2006, Idea Group Inc. Copying or distributing in print or electronic forms without written


