

Cus percu avg data source www
Cooperative Economic Theory
Lecture 4
|
|---|
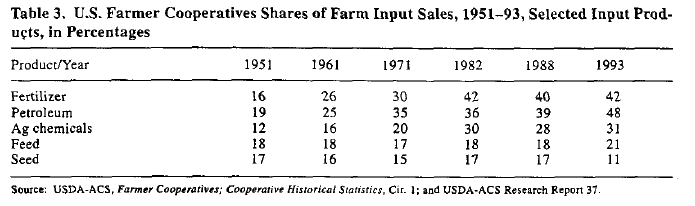
Livestock processing is capital intensive, and seed subsector is R & D intensive. 1.2 Why Aren’t Cooperatives the Dominant Form of Agribusiness in the United States?
Pacemaker Theory- The very existence of a successful cooperative makes for greater efficiency amongst the competitors, so that even when price and service adjustments have been effective, the organization is kept in being to fulfill a pacemaker role.
Mop-Up Theory- In static or declining markets, IOF may have little to lose by acting opportunistically. Such behaviour may therefore crest incentives for farmers to integrate forward via cooperatives in these this markets.
|
|
|---|---|
| Stage Four |
|
|
1.4 What implications can you get from the theories above?
2.Banks2
2.1 Some facts
(1)Thrift institutions are composed of three different groups of FIs: savings associations, savings banks, and credit unions, and the first two are also named as “savings institutions”.2.2 Savings Institutions: Mutual vs. Stock ownership form
(1)Historically, most savings associations (and savings banks) were established as mutual organizations (in which the depositors are the legal owners(?) of the institution and no stock is issued).(2)As a mutual organization, member deposits represent the equity of the savings associations.
mutual savings association managers can concentrate on low-risk investments and prevention of failure rather than higher risk investments needed to produce higher required returns on stockholders’ investment.
(4)However, through time many savings associations (and savings banks) have switched from mutual to stock charters (in which the holders of the stock or equity are the legal owners of the institution rather than depositors under the mutual charter). This is mainly because stock ownership allows savings institutions to attract capital
investment from outside stockholders beyond levels achievable at a mutual
institution.
| CU AVG% |
|---|
|
||||
|---|---|---|---|---|
|
|
12.81 | CUs by 36 bp | |
| 7.01 | CUs by 131 bp | |||
| 6.05 | 7.74 | CUs by 169 bp |
(4)Safety relative to Banks (Data Source: http://doig.cuna.org/download/freq_compar.pdf)
|
|---|
(5)CU Industry Performance
(a) The decrease in ROA from 1993 through 1999 is mostly attributed to earnings decreases at the smaller CUs. For example, the 75 largest CUs (that serve 17 percent of the industry’s customers) experienced an ROA of 3.41 percent in the first half of 1999, while ROA for the whole industry was 1.03 percent.
(2)U.S. CUs
(a)Trends
| Year | Number of | Members per | Savings per CU | Loans per CU |
|
|---|---|---|---|---|---|
| CUs | CU (Avg) | (Avg) | (Avg) | ||
| 1939 | 8,036 | 280 | 20,087 | 18,197 | 23,644 |
| 1969 | 23,866 | 904 | 573,396 | 541,294 | 664,282 |
| 2000 | 10,684 | 7,465 | 36,468,114 | 28,956,110 |
6
(4)Australia CUs
Ralston, Wright and Garden (2001)5: The paper finds and suggests that mergers are not associated with improvements in efficiency superior to those achieved by internal growth.
(a)The depositors in a mutual savings bank have no voting rights or other means of exercising direct control over the organizations.
(b)The control right lies in the hand of a self-perpetuating board of directors that holds the bank’s assets in trust for its depositors.
3.Non-Profit Organizations (NPOs)
3.1 Definition(1)Hansmann (2000): Although cooperatives are sometimes loosely said to be
net earnings. This does not mean that a NPO is barred from earning profits; rather, it is the distribution of the profits to controlling persons that is forbidden.
(2)This does not mean that a NPO cannot pay reasonable compensation to anyone who supplies labor or capital to the organization; it is only residual earnings that cannot be distributed.
In the U.S., such hospitals constituted only 12 percent of all nonfederal short-term general hospitals in 1994 [American Hospital Association]. By contrast, 60 percent of hospitals were organized as non-for-profit hospitals with the remaining 28 percent of hospitals being operated by governments or special government authorities.8
3.3 Why the non-for-profit form of hospitals is dominant?9
(1)Weisbrod: Information asymmetry (Seller knows more than the patients, and evaluating and rewarding performance is difficult.) Sellers will have incentives to expropriate consumers.Lower quality
(2)Explicit subsidies
8Sloan, Frank A., 2000, “Not-for-profit Ownership and Hospital Behaviour,” Handbook of Health Economics, Volume 1, Ch.21, Edited by A. J. Culyer and J. P. Newhouse, Elsevier Science B. V.
9See ft.8.
|
|---|
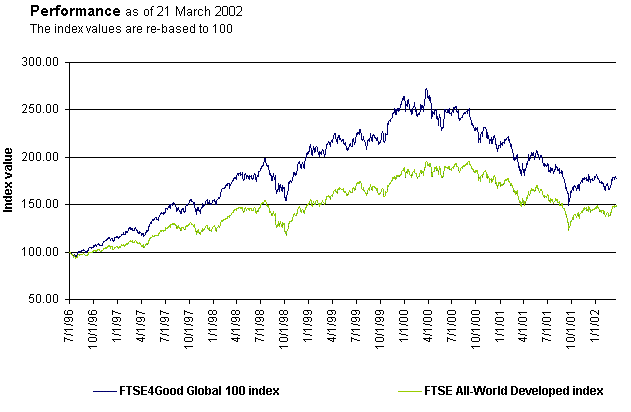
FTSE4Good is a series of benchmark and tradable indices facilitating
11FTSE Group is an independent company whose sole business is the creation and management of indices and associated data services. FTSE has no capital markets involvement. The company originated as a joint venture between the Financial Times and the London Stock Exchange.
5. Financial Management on the NPOs
5.1 Earnings management
Leone and Van Horn (1998)12 examines the incentives of CEOs in not-for-profit institutions to engage in earnings management. They predict and find that, with one exception, this different setting induces CEOs to engage in patterns of earnings
management that are similar to those of their for-profit counterparts. Those patterns of earnings management include (1) income smoothing, (2) taking “big bath” in the year of a CEO change, (3) avoid small loss, (4) no evidence that CEOs manage earnings to avoids negative earnings changes. This is noteworthy given that the structure of compensation and the objectives of not-for-profit organizations differ from for-profit organizations.


