

Called the data warehouse bus architecture shown figure
Data Warehouse Design for E-Commerce Environment
Il-Yeol Song and Kelly LeVan-Shultz
College of Information Science and Technology
Drexel University
Philadelphia, PA 19104
(Song, sg963pfa)@drexel.eduDesigning a data warehouse is time-consuming. Pressures from business, both internal and external, are forcing data warehouse projects to show their usefulness to the business quickly. The data warehouse designers must be certain that the data warehouse
1
The remainder of this paper is organized as follows: Section 2 discusses our data warehouse design methodology. Section 3 presents requirement analysis aspects and interesting OLAP queries in e-commerce environments. Section 4 covers logical design and development of dimensional models for e-commerce. Section 5 discusses physical
2
The data warehousing design methodologies are still evolving as data warehousing technologies are evolving and we do not have a thorough scientific analysis on what makes data warehousing projects fail and what makes them successful. According to a study by the Gartner group, the failure rate for data warehousing projects runs as high as 60%. Our extensive survey shows that one of the main means for reducing the risk is to adopt an incremental developmental methodology [MC98, AM97, KRRT98]. These methodologies let you build the data warehouse based on architecture. As we gain more experience with data warehousing projects, the design methodologies will also become mature. There are several design methodologies discussed in the literature. Meyer and Cannon [MC98] present a detailed 22 steps to develop a data warehouse from team building to the implementation phase. Anahory and Murray [AM97] also presents an architecture-based methodology for a data warehouse development. In this paper, we adopted the data warehousing design methodology suggested by Kimball and others [KRRT98]. The methodology to build a dimensional model consists of the following four steps:
1.Choose the data mart
2.Choose the grain of fact table
3.Choose the dimensions appropriate for the grain
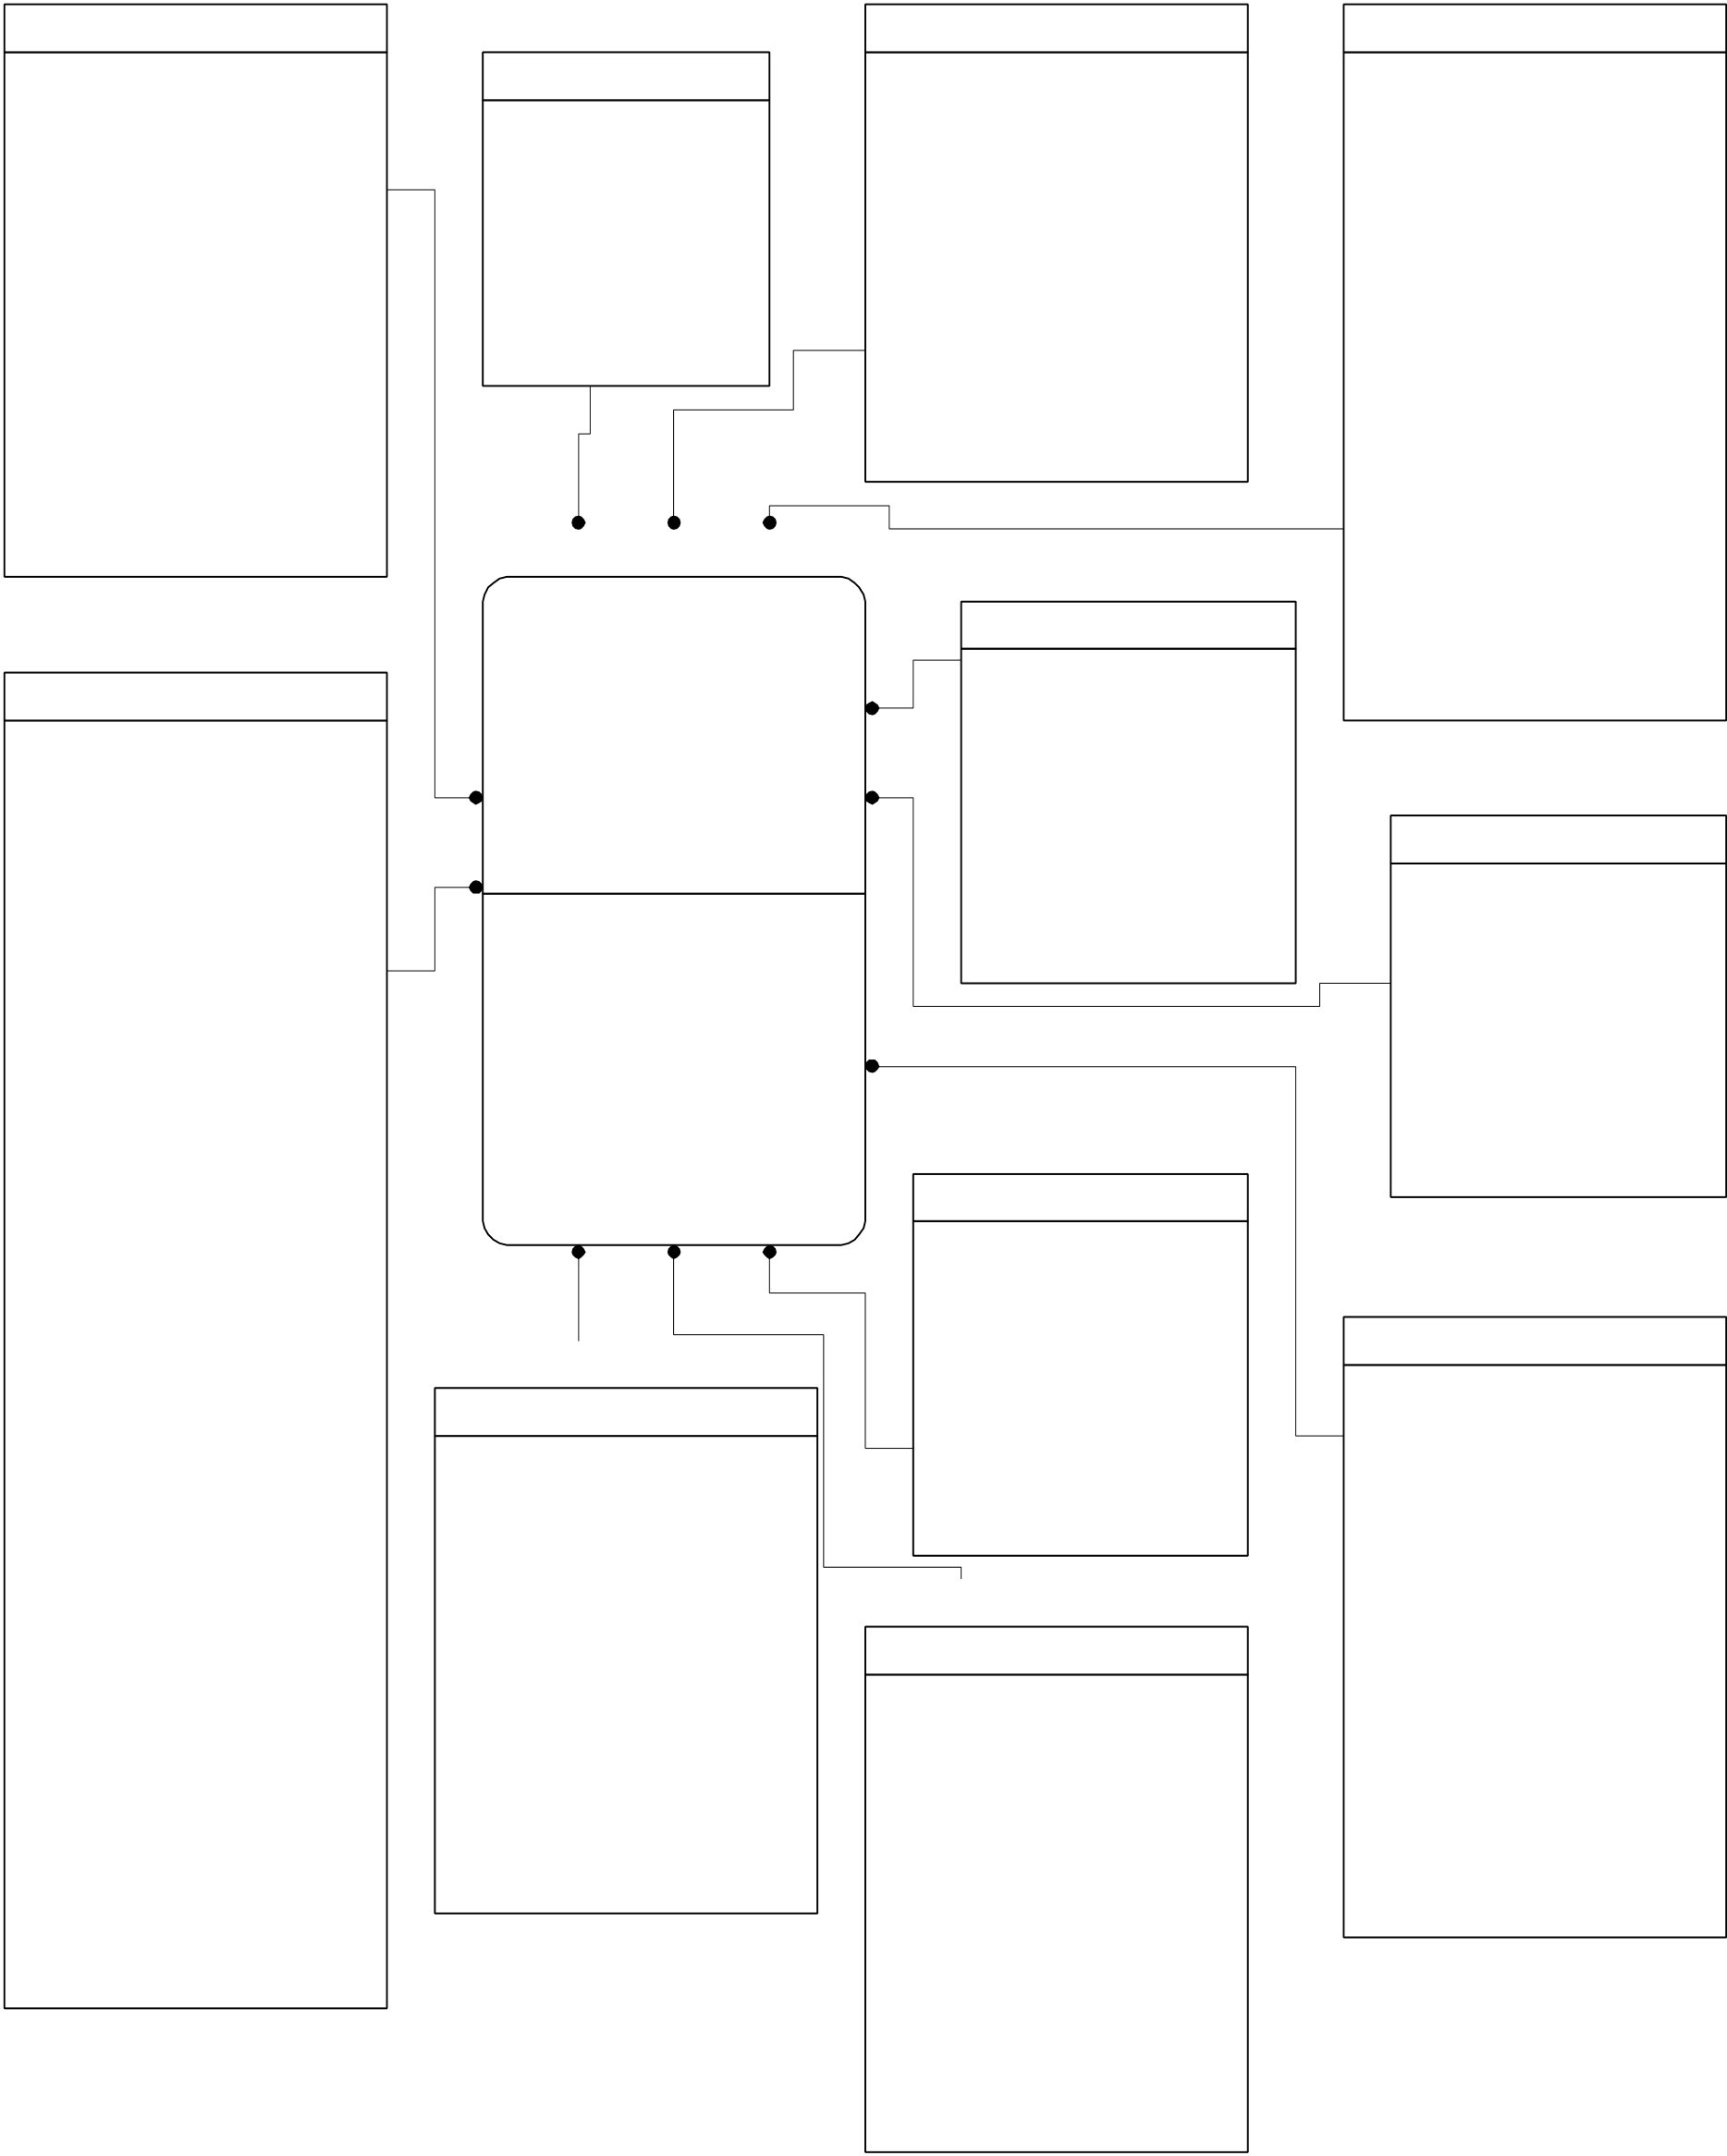
4.Choose the facts.Our design methodology is based on [KRRT98] and can be summarized in Figure 1. We have collected an extensive set of OLAP queries for requirement analysis. We used the OLAP queries as a basis for the design of the dimension model.
| Collect | Categorize | Determine | Choose the | Determine | Determine | Determine | |
|---|---|---|---|---|---|---|---|
| subject areas | |||||||
| and dimensions | the grain of | attributes | attributes | ||||
| OLAP | OLAP | ||||||
| a data | for the data | subject area | the fact | for the | for the fact | ||
| queries | queries | ||||||
| warehouse bus | table | dimensions | table | ||||
| architecture |
3
3. Requirement Analysis for Data Warehouses in E-commerce
3.2 OLAP Queries for E-commerce
Many business analysts are spending the majority of their time finding the data they need and formatting it for their statistical applications, and only a small fraction of the time actually analyzing the data for the business. The data warehouse needs to provide these business analysts with the useful data that they need in a usable format, therefore the requirement specifications should start with the business analysts. The best place to start is by interviewing the business analysts and determining the questions that are being asked about the business. Most business analysts can rattle off at least twenty questions that have been asked of them in the past week or month depending upon the business.Our approach for requirement analysis for data warehousing in e-commerce environment was to go through a series of brainstorming sessions to develop the OLAP (online analytic processing) queries. We visited actual e-commerce sites to get
Sales & Market Analysis
•What is the purchase history/pattern for repeated users?•What type of customer spends the most money?
•How many different vendors are typically in the customer's market basket?•How much does a particular vendor attract one socio-economic group?
5
•What are the top 5 most profitable products by product category and demographic location?
•What are the top ten products that customers purchased in conjunction with product X?
•What is our average volume of business per product category per sales channel?•What items are requested but not available and how often and why?
•What is the best sales month for each product?
•How many items are in the average order?
•What products attract the most return business?
•Based on history and known product plans, what are realistic, achievable targets for each product, time period and sales channel?
•What is the sales to plan percentage variation for this year? What is the planning discrepancies?
•How often did a customer request a refund and how often did they request an exchange for another product?
•What are the top 5 products which have been returned by customers after purchasing?•Do customers who complain or return items make future purchases?
•How often are purchasers looking at detailed product information by vendor types?
•What are the top ten most visited pages? (Per day, weekends, months, seasons)•How much time is spent on pages with banners and without banners?
•Do products with pictures and extended descriptions sell better than those without pictures?
•Where are high-spending customers surfing to our website from?
•Do items highlighted on the main page sell better?
•What % of customers who leave items in shopping basket return later and purchase them?
•Make recommendations for future purchases to the client, based on what the client purchased in the past.
Customer service
•What are the top 5 complaints about the products or services?
•What is the average back-order time, i.e. the time, when a product is out of stock, from when a customer orders the item until it is back in stock and shipped?
•Do we have adequate inventory for a particular product to meet anticipate demand?
•Is there a correlation between promotions and sales growth?
•Are some sales group achieving their monthly or quarterly targets by excessive discounting?
4. Logical Design
In this section, we present the details of logical design of data warehouse for e-commerce environments. Our methodology has been inspired by the work of Kimball [KRRT98].
The matrix allows us to identify so-called conformed dimensions. The conformed dimensions are those that are used by multiple data marts. Designing a single data mart still needs to examine other data mart areas to create a conformed dimension. This will ease the integration of multiple data marts into an integrated data warehouse later.
The E-commerce business has several significant differences from regular businesses. In the case of E-commerce, you don’t have a sales force to keep track of, just customer service representatives. You can’t influence your sales through a sales force incentives in e-commerce therefore the business must find other ways to influence its sales. This means that e-commerce businesses must pay more attention to their
promotions and advertisements to determine their effect upon the business. This means tracking coupons, letter mail lists, e-mail mailing lists, banner ads, and ads within the main website.
4.2 Dimension Models
4.2.1 Grain of the Fact Table
By analyzing the OLAP queries and creating the data warehouse bus architecture, the designers now have requirements they need to start building the data warehouse. The focus of the data warehouse design process is on a subject area, which is most often determined by the business before assigning a project. With this in mind the designers return to analyzing the OLAP queries with a different purpose in mind. Before they decide about dimensions, dimension attributes, or fact attributes, they need to know the grain of the fact table. The grain determines the lowest, most atomic data that the data warehouse will capture. The grain is usually discussed in terms of time such as a daily grain or a monthly grain. The lower the level of granularity, the more robust the design is since a lower grain can handle unexpected queries and additional new data elements later [KRRT98]. For a sales subject area, we want to capture daily line item transactions. The designers have determined that from the OLAP queries collected during the course of the requirement definition, the business analysts want a fine level of detail to their
information. For example, one OLAP query is “What type of products do repeat customers most often purchase?” In order to answer that question the data warehouse must provide access to all of the line items on all sales because that is the level that associates a specific product with a specific customer.4.2.2 Dimension Table Detail Diagrams
After determining the fact table grain, then the designers proceed to determine the dimensional attributes. The dimensions themselves were already determined when the data warehouse bus architecture was designed. Once again, the warehouse designers return to analyzing the OLAP queries in order to determine important attributes for each of the dimensions.
|
department |
|
|---|
Individual product (5,000
|
(50 | |
|---|---|---|
| measure | ||
| (20 | (50 | |
| color | size |
Returning to our example query, the next attribute found is the IP(internet protocol) address. This is a new attribute to be captured in the data warehouse since a traditional business doesn’t need to capture IP addresses. The next question is “which dimension do we put it in?”
The customer dimension detail diagram is where the ISP(Internet Service Provider) is captured. There is some argument around placing it directly within the customer dimension. In some cases, depending upon where the customer information is derived from then the designers may want to create a separate dimension that collects e-mail addresses, IP addresses, and ISPs. Design arguments such as these are where the data warehouse design team usually starts discussing possible scenarios. There is a compelling argument for creating another dimension devoted to on-line issues such as e-mail addresses, IP addresses, and ISPs. Many individuals surf to e-commerce websites to look around. Of these individuals, some will register and buy, some will register but
11
| are | (100,000) | (100,000) |
|
|---|---|---|---|
| slowly |
|
||
| (3) | Customer | (10) |
|
||
|---|---|---|---|---|---|
| (full_name, | |||||
| first_name, | |||||
| credit_status | |||||
| middle_name, | |||||
| (36,500) |
|
last_name) | M:M | ||
| could be M:M | |||||
| (2 million) | payment type | ||||
| website | email,ISP & website | ||||
| (1,000) | |||||
| ISP | more rapidly | ||||
| changing | |||||
also needs to track the second set of individuals, those that don’t buy, which the business will have incomplete or sometimes completely false information on.
The question that needs to be asked of the business is how they want to capture and use this information. Are they willing to tolerate incomplete and sometimes false information from potential customers in their customer dimension? If not, then a separate dimension should be created to maintain this data. Here we are only analyzing data as related to customers who have actually purchased products so the separate dimension is not depicted. The rest of the customer dimension contains the standard information captured by most businesses as it pertains to their customers.
Lastly, one of the hardest decisions was where to capture website design and navigation. Does it belong in a subject area of its own or is it connected to the sales subject area? Kimball has presented a star schema for a clickstream data mart [Kimb99].
While this star schema will capture individual clicks (following a link) throughout the website, it does not directly reflect which of those clicks result in a sale. The decision to include a website dimension within the sales star schema must be made in conjunction with business experts who will ultimately be called upon to analyze the information.
(2)
picture_flag
on_page
(4)banner_type
(4)master ner /URL description
(2)
These are just a few examples of the dimension detail diagrams that were devised for the e-commerce star schema. After several iterations of determining attributes, assigning them to dimensions, and then gaining approval from the business experts, then the design of the dimensions stabilizes.
4.2.3 Fact Table Detail Diagram
Next, the fact table’s attributes must be determined. All the attributes of a fact table is captured in fact table detail diagram as in Figure 7. The diagram shows a complete list of all the facts including derived facts. Often the facts will be directly determined from the transaction record. In this case, the record of a sale is the order and it doesn’t matter whether it’s a slip of paper or an electronic record. The basic facts that
|
|---|
15
In this section, we present the consideration of storage and indexing for physical design. Finally, we discuss the aggregation of the fact table and show an example aggregation schema.
5.1 Storage and Indexing
During the physical design, the warehouse designers make the decisions about how the warehouse will be implemented into the database. Many of these decisions will be based upon which commercial database they have chosen to use for the data
warehouse. Regardless of the choices of database, some issues in the data warehouses’physical design are universal. In this paper, we assume we implement our design in Oracle8. We do not discuss other physical considerations such as partitioning for the lack of space.
Again, to take advantage of parallel processing, the indexes for the dimension tables should be in a separate tablespace from the actual dimension tables themselves. The fact indexes should also be in a separate tablespace from the actual fact table. There are arguments for containing all indexes, both on the fact and dimension tables, in the same tablespace. In practice, it seems best to keep them segregated so that access to indexes on dimension tables can occur at the same time as access to indexes on the fact table do.
Indexing
Indexing schemes alone can be a hotly disputed topic on the data warehouse team. Indexing generally falls within the role of the database administrator (DBA), but the design team is also necessary at this point to guide the DBA’s decision. Two main indexing techniques used for data warehousing environments are bitmap indexes [BI98] and join indexes [OG95, Vald87]. A bitmap index is a B tree in which each leaf node is associated with a N-bit string for N rows, where each bitmap stream is created for each value of the index. For example, a bitmap index for a gender attribute for 1 million customers will create two bitmap streams where the size of each is 1 million bits. These bitmap indexes are usually created for low cardinality attributes and perform fast AND, OR, and NOT operations. A join index is an index that is created based on joins between two tables. A join index can also be created among more than two tables. In that case, the join index is called a multi-table join index.
have an additional individual index, either bitmapped or B tree. The type of index will again depend upon the cardinality of the attribute, as low cardinality attributes will have bitmapped indexes and high cardinality attributes will have B tree indexes. In this case, the product_key, the customer_key, and the navigation_key will all have B tree indexes while the date_key, promotion_key, website_key, advertising_key, warehouse_key, ship_mode_key, and location_key could all have bitmapped indexes.
If a join index is available in a database system, we could create join indexes between the primary key of a dimension table and the foreign key of a fact table. For example, we could define a join index between customer dimension and sales fact table using the customer_key of customer dimension and sales fact tables.
19
|
|
||
|---|---|---|---|
|
|||
|
|||
|
|
||
|
|
||
|
|
||
|
|
||
|
|
||
|
|
||
|
|
||
|
|
||
|
|
||
| last_day_in_month_flag TEXT(1) (IE) | |||
|
search_page_access_flag TEXT(2) | ||
|
|||
| Promotion_Dimension | |||
|
|||
|
promotion_key INT | ||
| promotion_name TEXT(60) | |||
|
promotion_type TEXT(20) (IE) | ||
|
|||
| price_treatment CURRENCY | Warehouse_Dimension | ||
| ad_treatment TEXT(20) (IE) | |||
|
display_treatment TEXT(20) (IE) | ||
|
coupon_type TEXT(20) (IE) | ||
| ad_media_name TEXT(40) | |||
|
|
display_provider TEXT(60) | |
| promo_cost CURRENCY | |||
| promo_begin_date DATE | |||
|
|
||
| promo_end_date DATE | |||
|
|
||
|
|||
|
|||
|
|||
|
|||
|
|||
|
|||
|
|||
|
|||
|
|
||
|
|||
|
|||
|
|||
| cust_billto_international_postal_code |
|
||
|
|
||
| ship_mode_description TEXT(50) | |||
|
|||
|
|||
|
|||
|
|||
|
|
||
|
|||
|
|||
|
|||
|
|||
|
|
||
| cust_shipto_international_postal_code | |||
|
|||
|
|||
| contact_phone_country_code TEXT(3) | |||
|
|
||
|
|||
|
|||
|
|
||
|
contact_phone_area_code TEXT(3) | ||
|
|||
| contact_phone_extension TEXT(4) | |||
|
|||
|
|||
|
|||
|
|||


