
Statistical Analysis Scenarios Homework Answers Needed
Your Question:
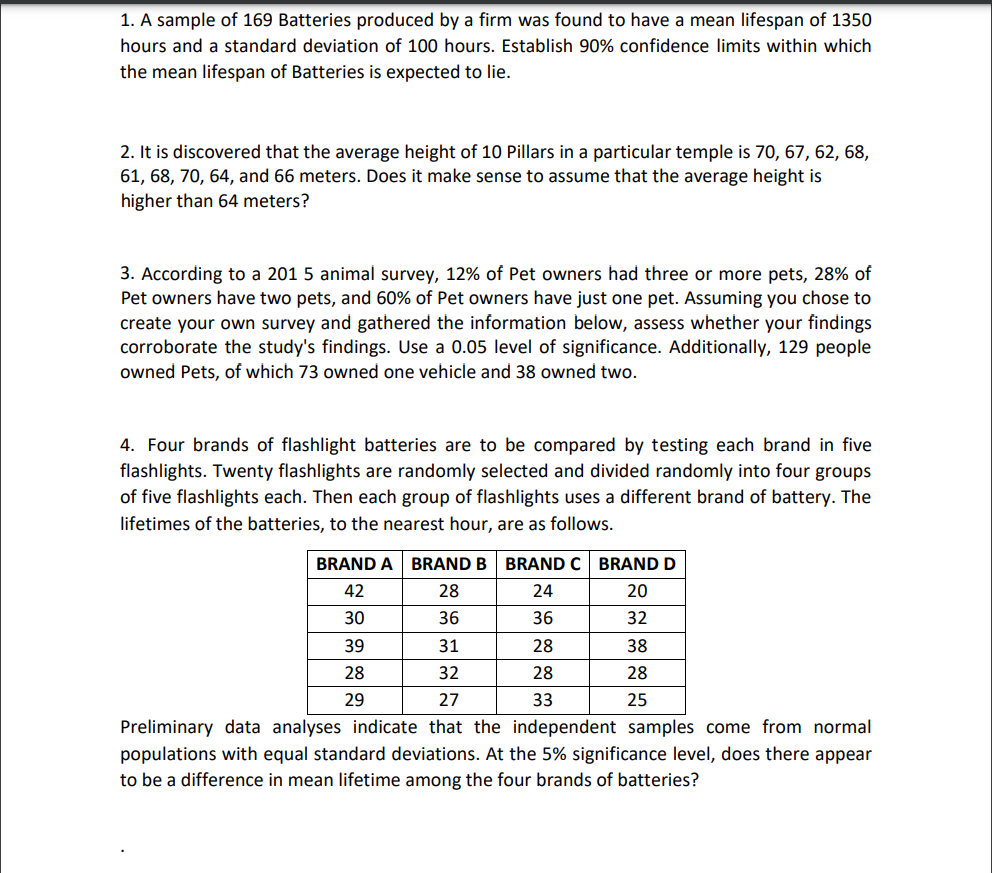
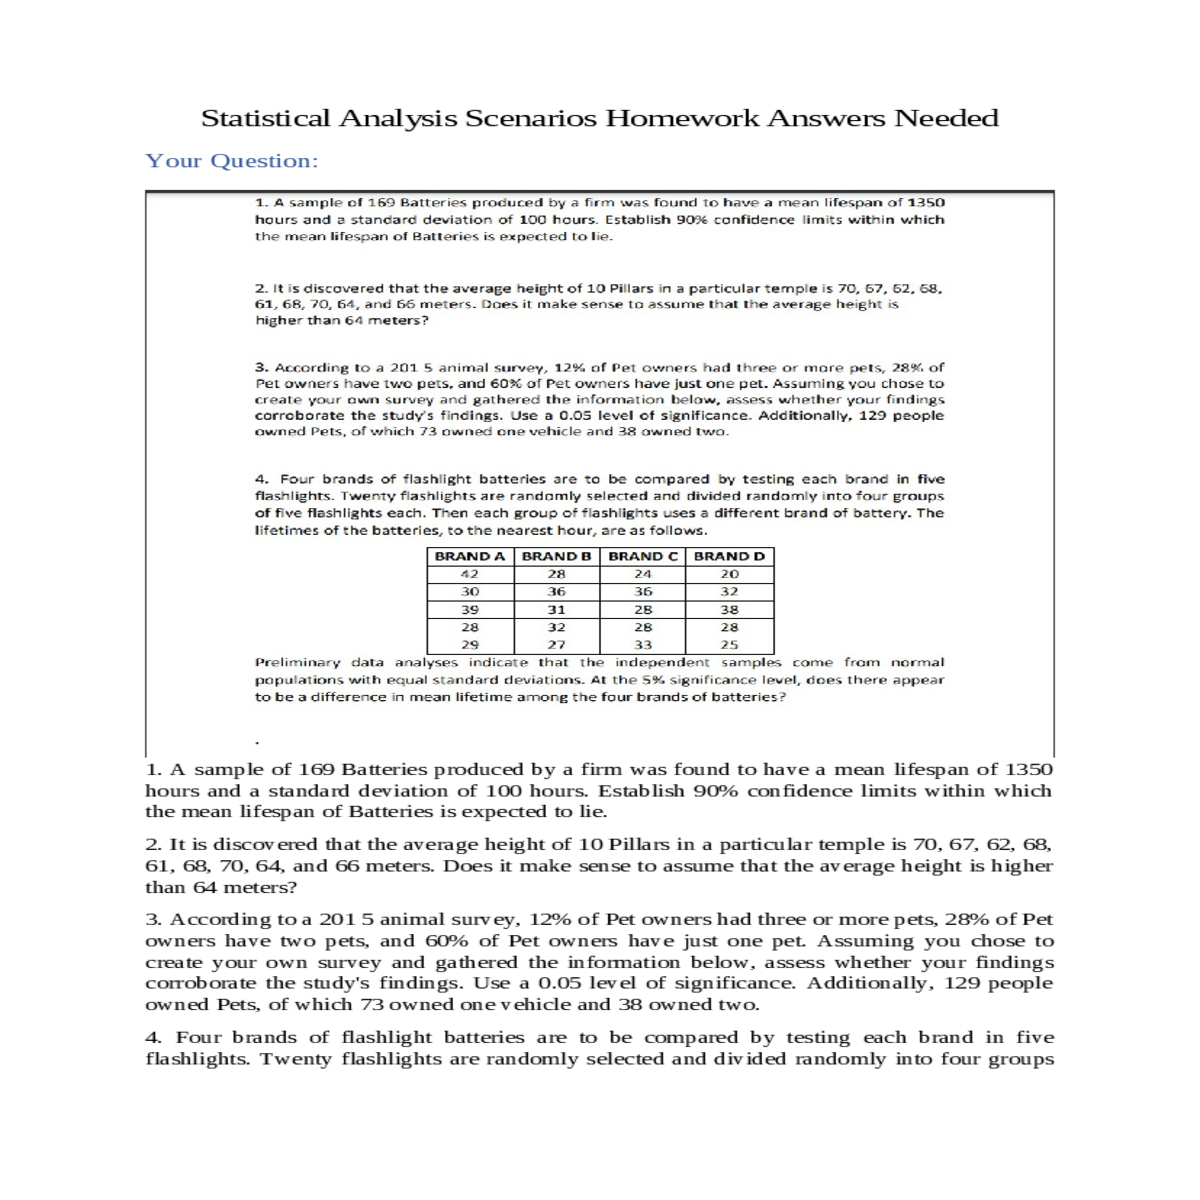
1. A sample of 169 Batteries produced by a firm was found to have a mean lifespan of 1350 hours and a standard deviation of 100 hours. Establish 90% confidence limits within which the mean lifespan of Batteries is expected to lie.
2. It is discovered that the average height of 10 Pillars in a particular temple is 70, 67, 62, 68, 61, 68, 70, 64, and 66 meters. Does it make sense to assume that the average height is higher than 64 meters?
Step By Step Answers with Explanation
1. Given Information:
- Sample Mean (\( \bar{x} \)): 1350 hours
- Margin of Error (\(E \)) = Critical Value (\( z \)) Standard Error (\( SE \))
- \(z \) value for a 90% confidence level is approximately 1.645 (you can find this in a standard normal distribution table).
4. Interpretation:
- The mean lifespan of batteries is expected to lie between the calculated lower and upper limits with 90% confidence.
- Null Hypothesis (\( H_0 \)): Average height is not higher than 64 meters
- Alternative Hypothesis (\( H_1 \)): Average height is higher than 64 meters
- Test Statistic (\( t \)) = \( \frac{\bar{x} - \mu}{\frac{s}{\sqrt{n}}} \), where \( \mu \) is the hypothesized mean (64 meters), and \( s \) is the sample standard deviation.
4. Find the Critical Value:
6. Interpretation:
- Based on the calculated test statistic and critical value, you'll determine whether there's enough evidence to conclude that the average height is higher than 64 meters.
- Expected frequencies: Based on survey findings
2. Formulate Hypotheses:
4. Calculate the Chi-Square Test Statistic:
- \( \chi^2 = \sum \frac{(O - E)^2}{E} \), where \( O \) is the observed frequency and \( E \) is the expected frequency.
- If the test statistic is greater than the critical value, reject the null hypothesis.
7. Interpretation:
- Null Hypothesis (\( H_0 \)): The mean lifetimes are equal for all brands.
- Alternative Hypothesis (\( H_1 \)): At least one brand has a different mean lifetime.
- Total Sum of Squares (\( SS_{\text{Total}} \))
- Between-Group Sum of Squares (\( SS_{\text{Between}} \))
- \( MS_{\text{Between}} = \frac{SS_{\text{Between}}}{df_{\text{Between}}} \)
- \( MS_{\text{Within}} = \frac{SS_{\text{Within}}}{df_{\text{Within}}} \)
7. Interpretation:
- Based on the calculated F-statistic and critical value, you'll determine whether there's enough evidence to conclude a significant difference in mean lifetime among the battery brands at the 5% significance level.


