Buying climax forms spike and ledge pattern intraday gold chart
CHAPTER14
A PICTURE'S WORTH A THOUSAND WORDS
110
up during that day's session. They also concentrate very hard on trading only two or three specific setups. They do not use oscillators or moving averages as they insist on being purists. (This chapter could have been titled, "TRADING‑THE SCHOOL OF MINIMALISM')
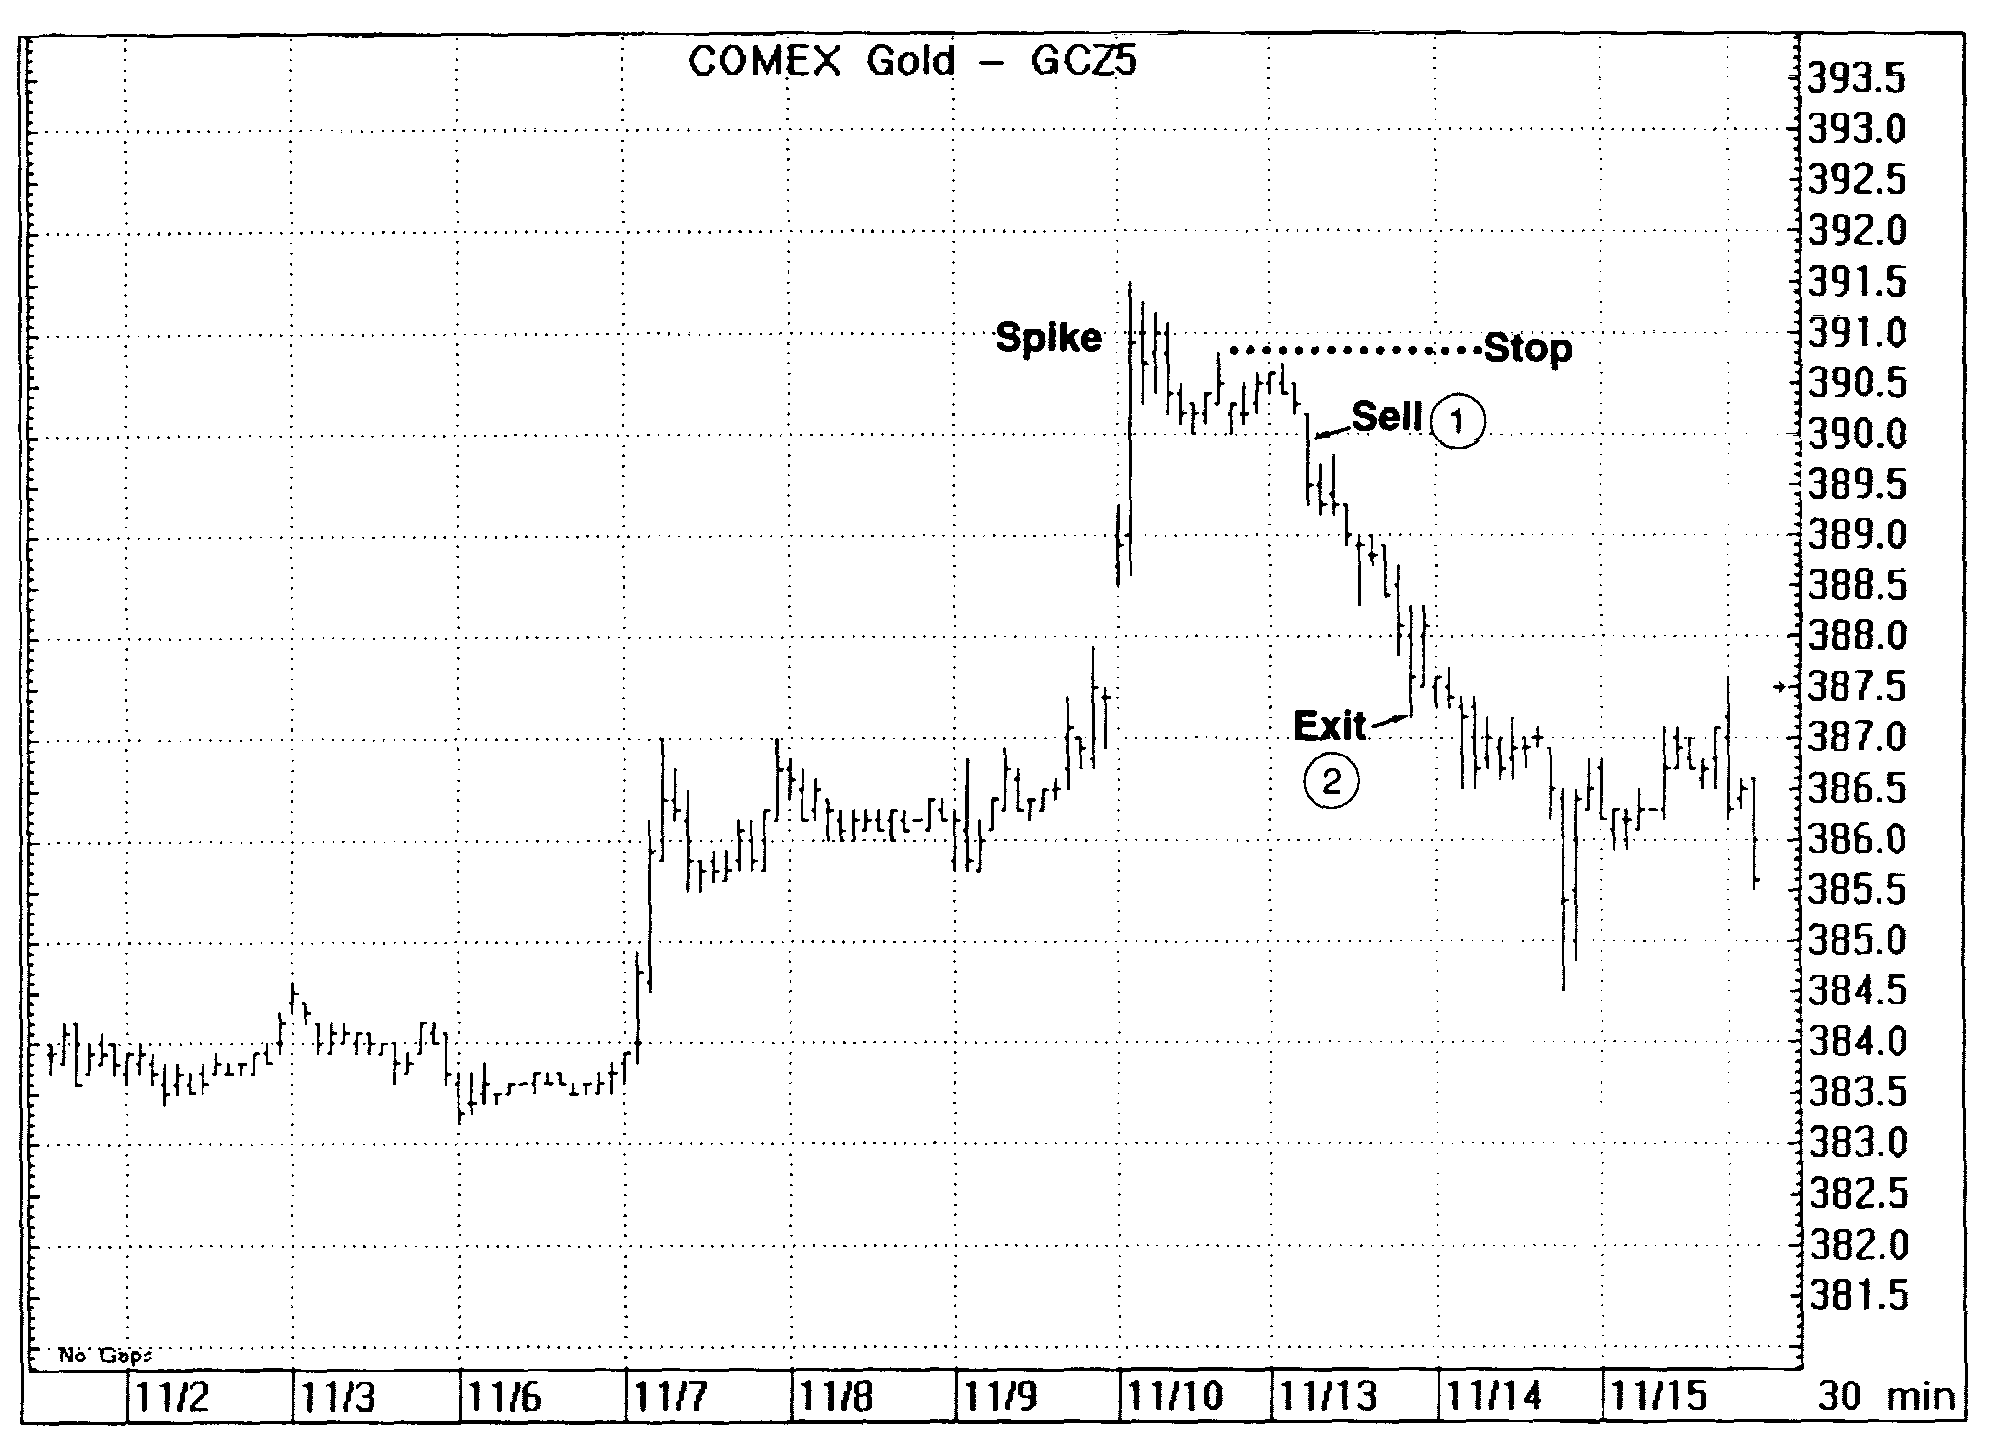
This first pattern is called "spike and ledge." Here, a buying climax forms a spike and ledge pattern on an intraday gold chart. A short trade is entered on the breakdown out of the ledge at point 1 and an initial stop is placed on the other side of the ledge. The market should not come back to this level. The market closes its gap and we probably would have exited the trade on the small range expansion bar at point 2.
113
EXHIBIT 14.3 S&P‑10‑Tick
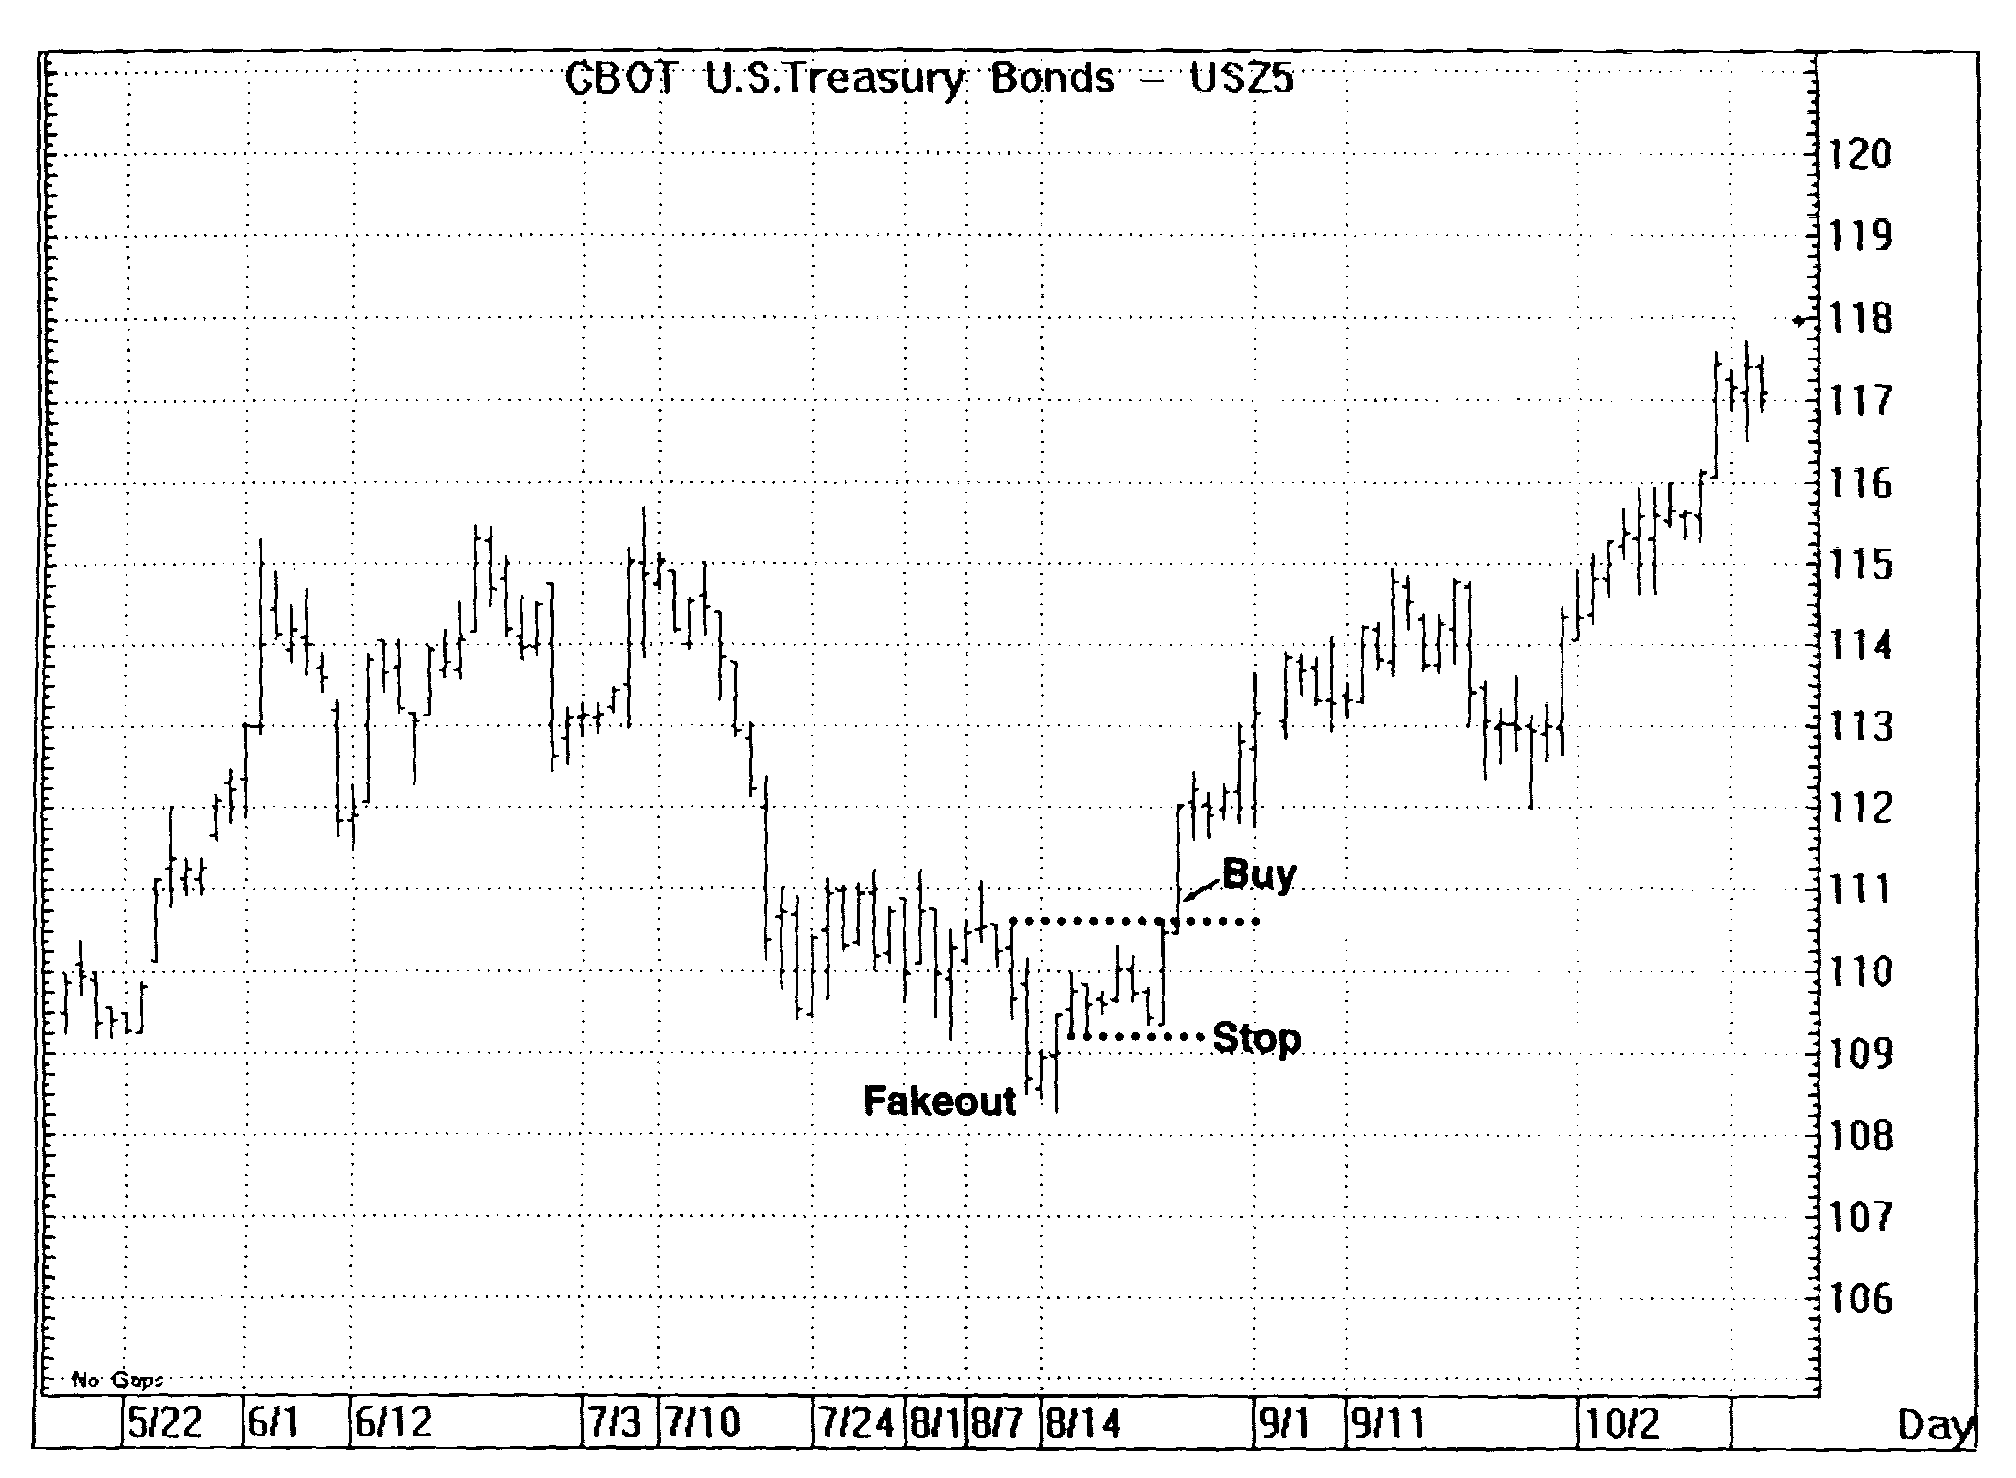
This pattem is called the "Fakeout‑Shakeout." Once a market breaks from a ledge or a triangle, it should not come back to the breakout point, or the apex of the triangle. If it does, it sets up an excellent trade in the other direction. The market has fooled and trapped the majority of the participants. In this particular example, a buy stop is placed just above the point from which the market broke down. The initial stop is entered at the most recent swing low. The market should not come back to this point. The stop is quickly moved up to breakeven, and then trailed appropriately to lock in profits.
116
EXHIBIT 14.6 S&P‑60‑Minute
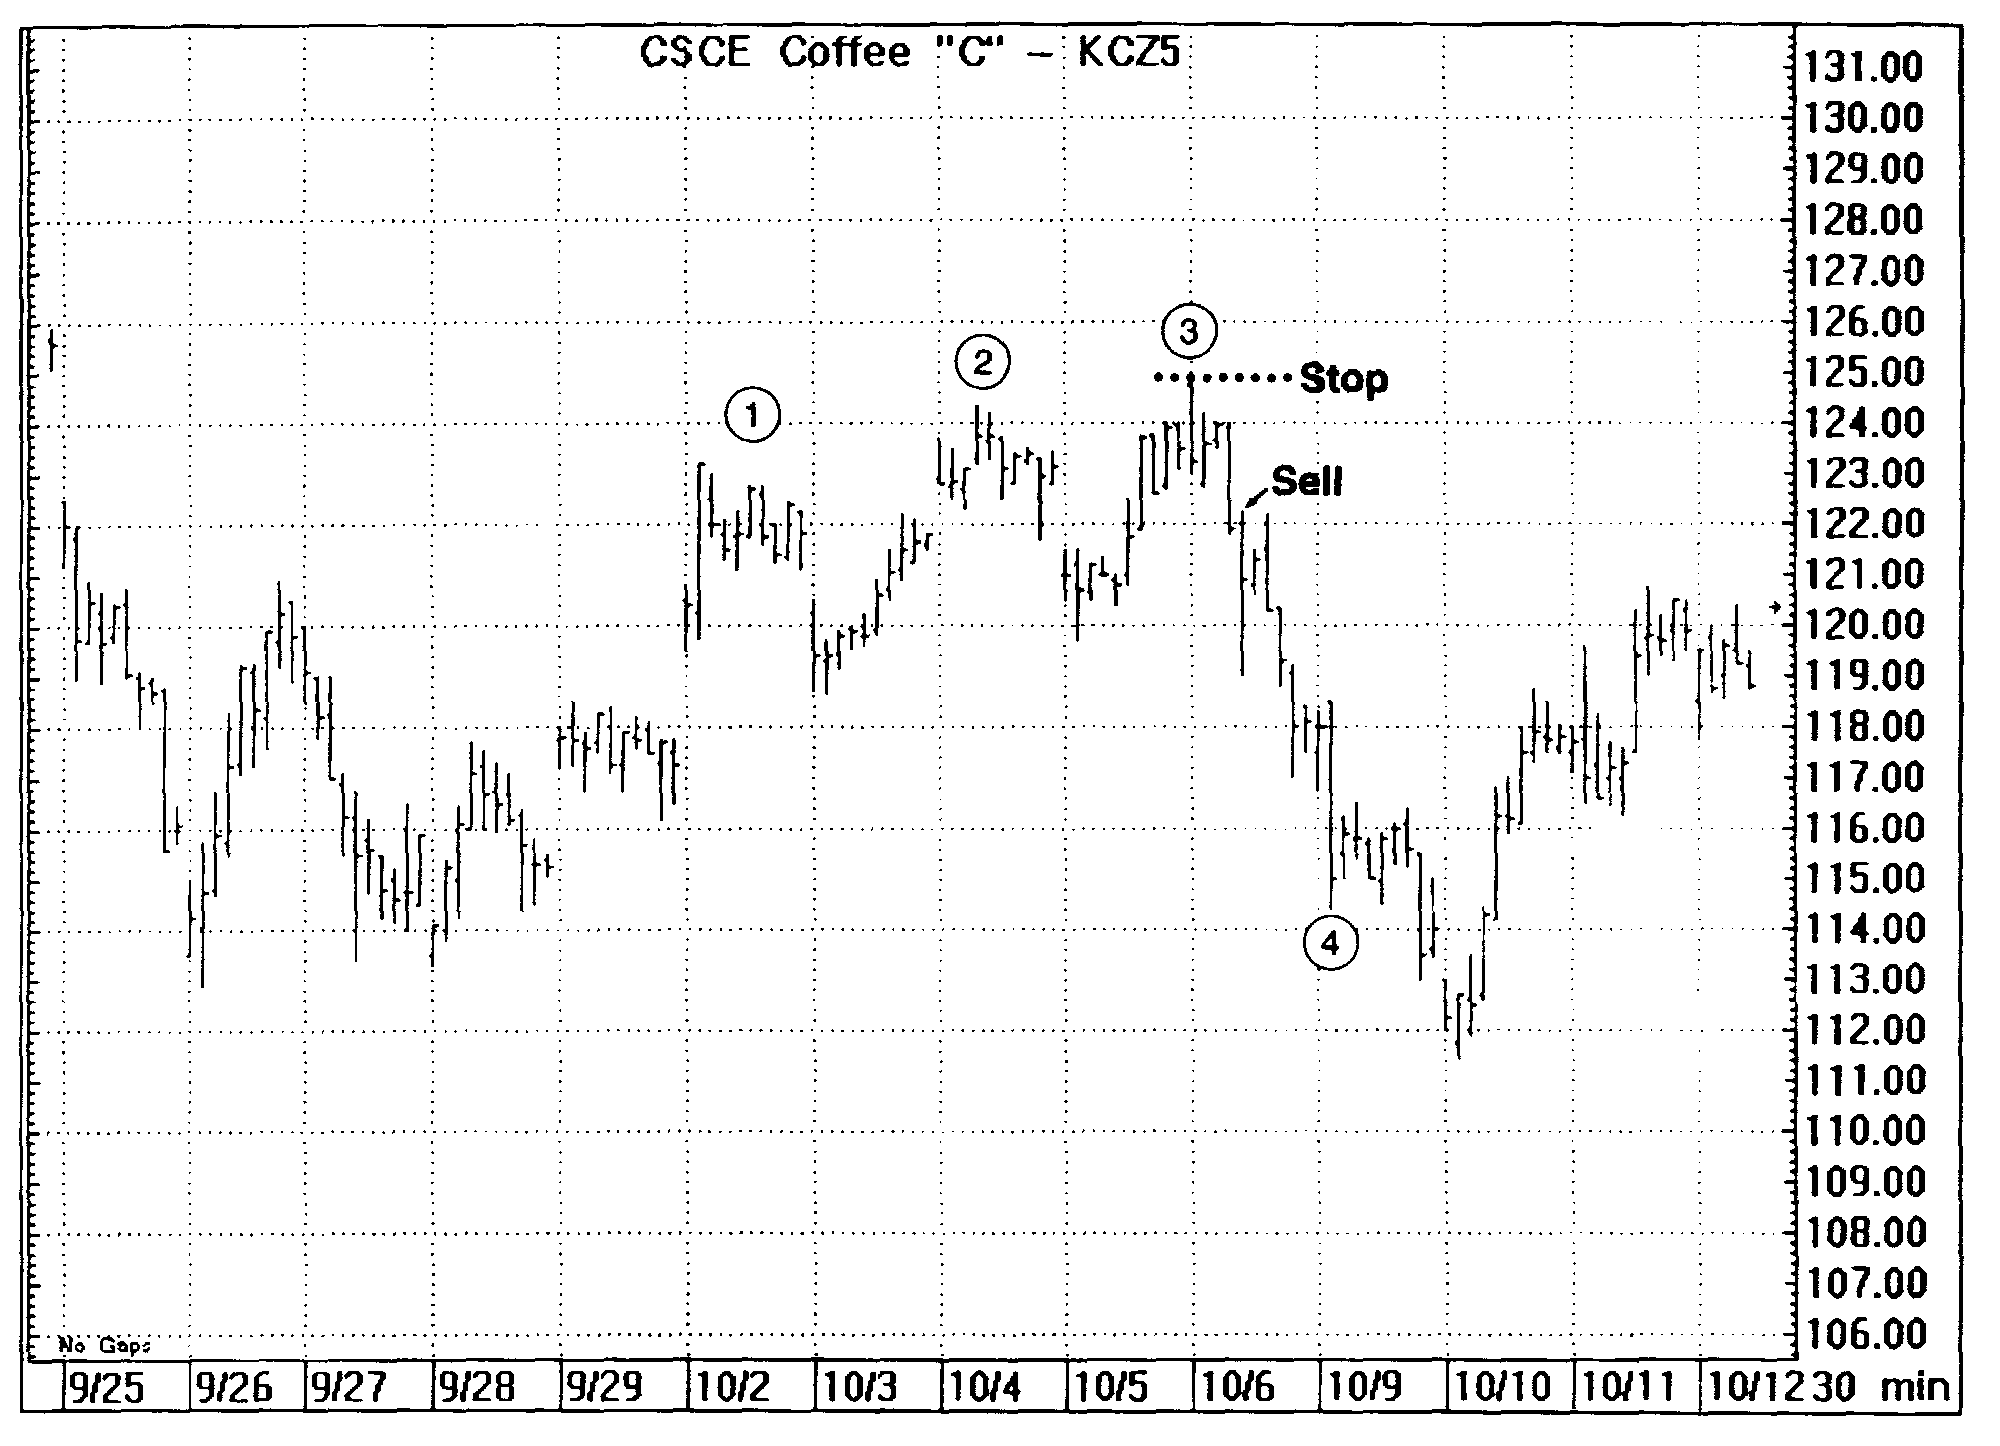
Three Little Indians‑coffee formed three symmetrical peaks after a sixday rally. The price starts to reverse and we enter the trade at‑the‑market. Our initial stop, at the most recent swing high, can be quickly moved to breakeven. The market closed weak so we carry the trade overnight. The next morning we cover our short position on the range expansion bar at point 4. We were in the market less than four hours total.
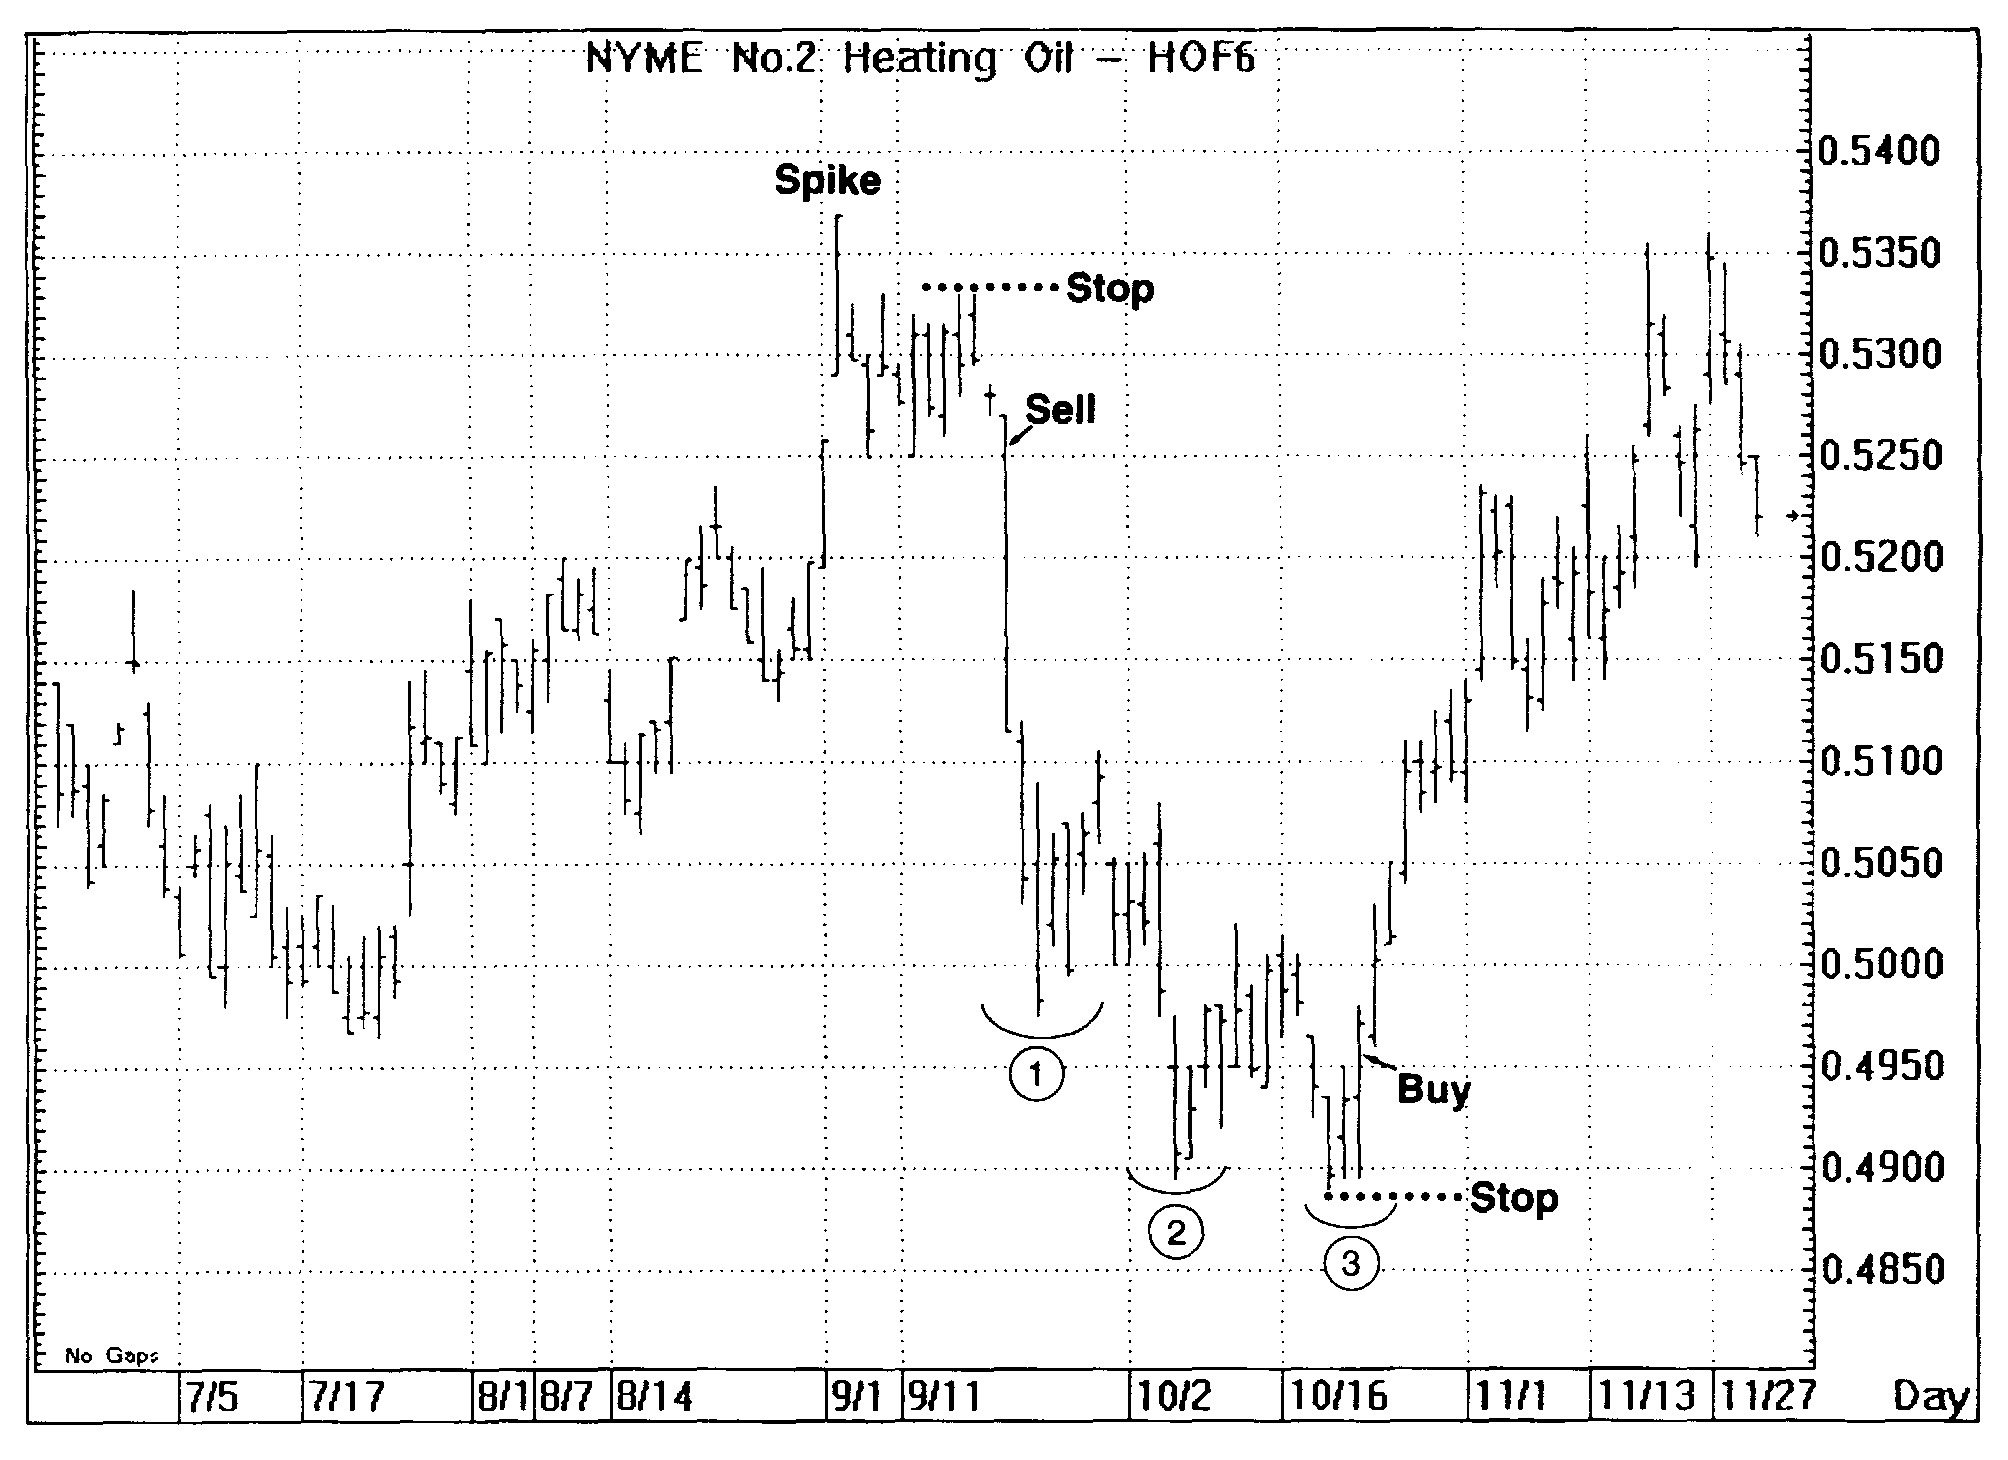
EXHIBIT 14.9 Heating Oil‑January 1996