
BIOLOGY LIFE SCIENCES QUESTION ANSWER
YOUR QUERY: The fat content of cow's milk may vary between 2,6% and 5%. A farmer has found that there is a high demand for low-fat milk (milk with a fat content of 3% or less). He determined the fat content in the milk produced by the cows on his farm. The results of his survey are given in the table below.
Draw a histogram to represent the results of the survey.
ANSWER WITH EXPLANATION
ANSWER 1
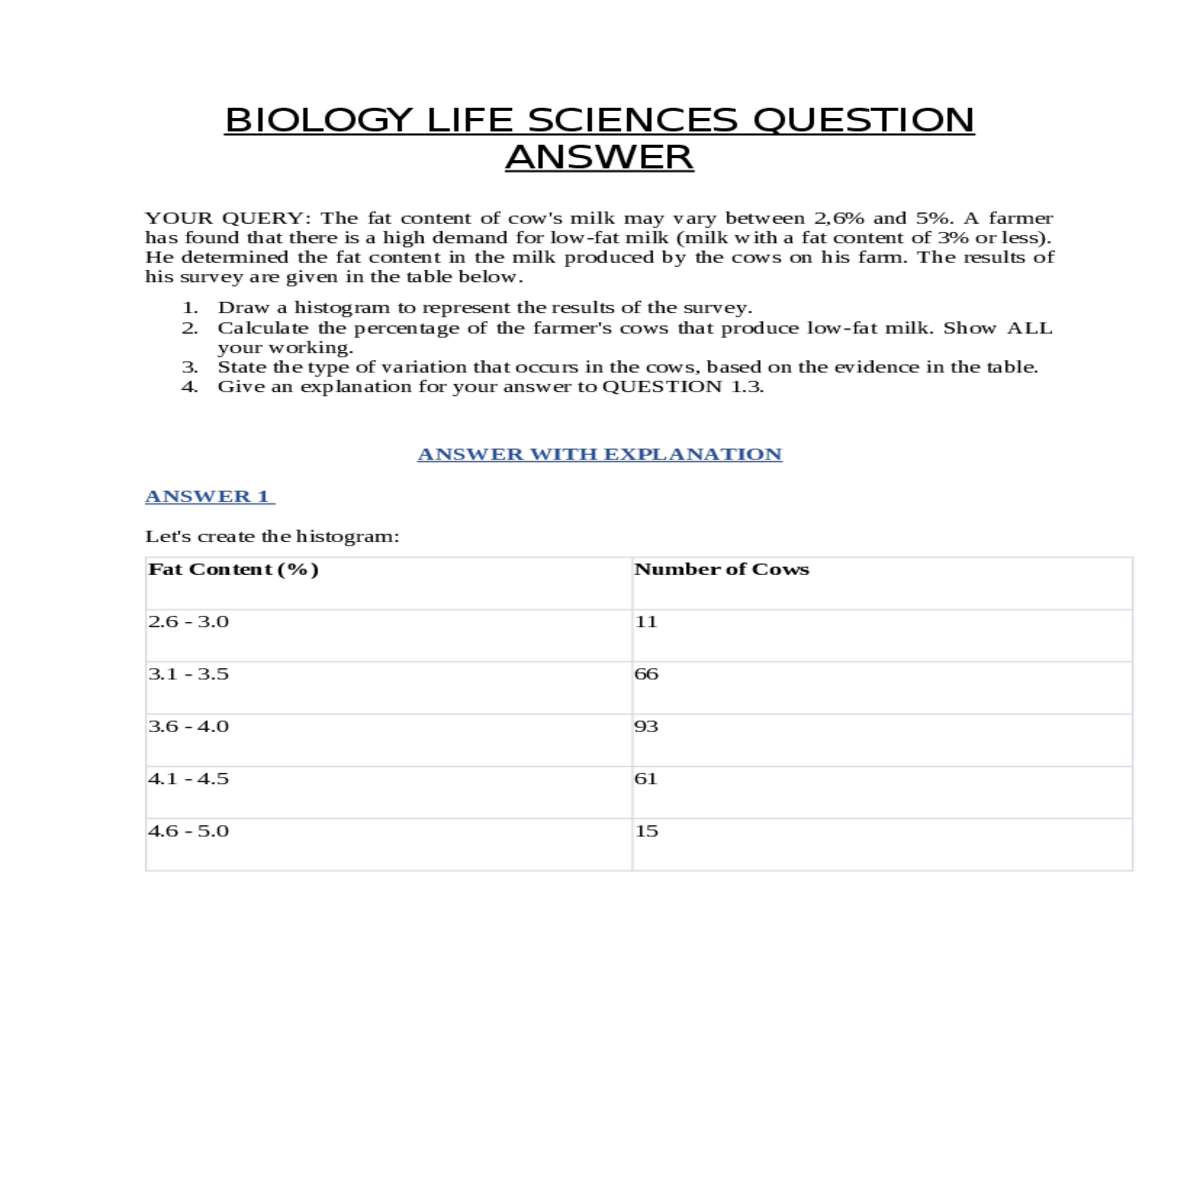
| Fat Content (%) | Number of Cows |
|---|---|
| 2.6 - 3.0 | 11 |
| 3.1 - 3.5 | 66 |
| 3.6 - 4.0 | 93 |
| 4.1 - 4.5 | 61 |
| 4.6 - 5.0 | 15 |
ANSWER 2
Now, let's calculate the percentage of the farmer's cows that produce low-fat milk (3% or less):
Total number of cows = Sum of the Number of Cows column = 11 + 66 + 93 + 61 + 15 = 246
ANSWER 3: Type of variation that occurs in the cows, based on the evidence in the new table:
ANSWER 4: Explanation for the answer to the updated QUESTION 1.3:
The fat content percentages are still continuous values, and the data is grouped into ranges (e.g., 2.6-3.0, 3.1-3.5, etc.). As seen in the histogram, the number of cows varies smoothly across the different fat content ranges, indicating continuous variation.
This continuous variation in fat content can still be attributed to various factors such as genetics, diet, and environmental conditions, contributing to a smooth range of fat content percentages among the cows on the farm. The data shows that a small percentage of cows (around 4.47%) produce milk with 3% or less fat content, which meets the high demand for low-fat milk.


