

Analysis of previous model and finding laging area:
Data Warehousing and Big Data
Assignment 2
Contents
The Process of designing the new dimensional models 3
Various Analysis for new design 4
Excel Power pivot & Power BI analysis: 10
Introduction:
Analysis of previous model and finding laging area:
In the product dimensions the attributes is low.
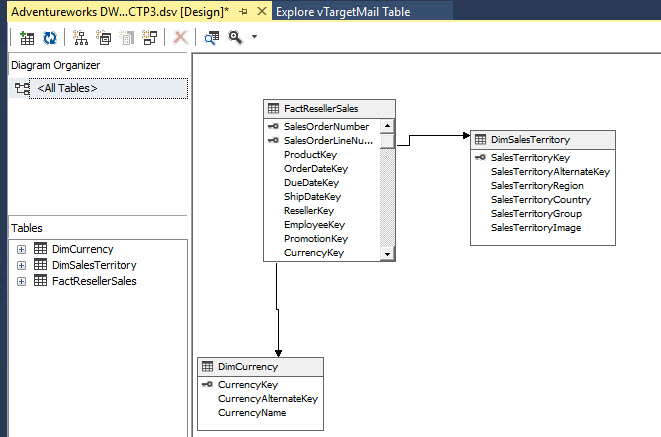
The Process of designing the new dimensional models
We have consider the above laging point during the design new models. The new model analze and include the all the requirements need for business improvement. In the models focuss on customer behaviour and puchase depens on the geographical based and season based view.The profit of business based on characteristics involved in the model.
Various Analysis for new design
Cube Features:
The purpose of creating a cube is not only to design it in the correct way. We have a transaction database called OLTP which stores all the live data and transactions. The OLAP database which stores historical data and can be used for reporting or analytical purpose and can be used for multidimensional processing.The queries are complex and the traditional method of database query is either slow.
The SSAS analysis:
SSRS Analysis:
Grouping the table according to week number:
Based on the graphs that we generated using SSRS, we can determine that the sales of beer during the thanksgiving week see an increasing trend. This graph could then be used to compare with the sales trend of an appropriate sales strategy during the season week could be used by the stakeholders to improve business. We can use this data to also use various promotions with other products that do not have much sales to help the business overall. A similar methodology could be used on other products during different holiday season to improve business. Hence, data warehousing beside with business intelligence can be used effectively.
MDX Analysis
Multidimensional Expressions (MDX) is used to creates you query multidimensional objects, such as cubes.
| SL.No. | Particulars | No. of Respondents | Percentage |
|---|---|---|---|
| 1 | Daily | 32 | 32 |
| 2 | Weekly | 34 | 31 |
| 3 | Monthly | 37 | 37 |
| 4 | Yearly | 00 | 0 |
| Total | 103 | 103 |
SSDT analysis:
In this analysis indicates that customers are fully satisfied about time convenience of shopping. The most of the customers rated strongly decide by 65 respondents and 32 of them rated agree. Business need to improve the space which results non convenience in shopping by customer from the cumulative score. The modern & well equipped attribute has supported to the shop and ranked third.
Excel Power pivot &Power BI analysis:
Table 3: Customer Distance Based
|
|||
|---|---|---|---|
|
|
||
|
|||
|
|||
|
|
||


