

Among them the patrick ewing theory and the hot hand theory
More than a Game:
The Game Theory of Basketball
Introduction
What makes a player or team great? This is a question that is much easier to answer in sports like tennis where players compete against each other in similar settings and circumstances. Baseball is more difficult since it’s a team sport, but the book (and subsequent film) Moneyball shows that because it is a sport with a sequence of discrete, steady encounters between the pitcher and hitter it is possible to use statistical rankings and analysis to find player and team strengths and weaknesses. However, basketball is much more difficult to use one empirical system of game theory since unlike the aforementioned sports each aspect of the game is considerably more variable.
“Moneyball” of Basketball Stats
In Dean Oliver’s book Basketball on Paper, he provides an explanation of how to record data of a team manually and through an analytical program named “Roboscout” that he licenses privately to the Sonics. He determined that the most important factors (with their weighting in parentheses) are shooting a high field goal percentage (10), not committing turnovers (5-6), getting offensive rebounds (4-5) and getting to the foul line (2-3) (Lyons). Generally, teams that win games do at least three of these well. Oliver also places an emphasis on efficiency to account for varying paces that games might be palyed. The field goal percentage is extremely important since the team with the higher percentage in the NBA wins 79% of the time, with turnovers also being costly as the team with fewer of them wins 58% of the time (Lyons). Surprisingly, Oliver found that it is more important for a team to get to the foul line frequently then for them to make shots, likely because taking a lot of foul shots means the other team’s players may be in foul trouble. Something else that coaches will want to consider is that height is more important to offensive success than defense and the top offensive teams are taller than the top defensive teams (Lyons). Oliver expands these statistics by creating rating scales to differentiate between popular and efficient players. Finally, he notes that team chemistry is important but difficult to quantify as it is made up of having a team with well-balanced skills and players willing to contribute to the team’s balance instead of their own self-interest.
Game Theory in Basketball
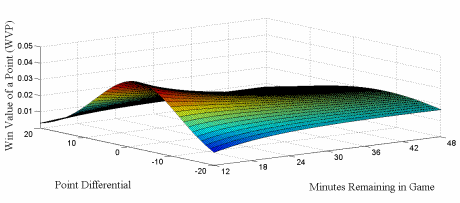
At its core, basketball is a game that can be analyzed as a set of actions. It can be modeled as a zero-sum game in which two actors (in this case the two teams) are both pursuing the same goal (to win the game). This is considered to be a zero-sum game since if one team wins the other must lose. Shawn Ruminski of Mercyhurst University analyzed the game theory of foul trouble and whether to shoot a 2 or 3 in late game situations (when 20 or fewer seconds remain).
The data suggests that coaches are too cautious when players have foul trouble and would increase their chances of winning by playing players more often during key moments which can be seen through this graph:
League-wide 3 point FG% in 2011-2012: 34.8%
Open 2 pt. FG% (from eFG%): 62.5%
The matrix above suggests that there is no dominant strategy so each will use mixed strategies to remain unpredictable to their opponent. The following equation determines whether or not a team should shoot a three, where q is the percentage of the time the defense will guard the three:

The Patrick Ewing Theory
Sometimes statistical models come from the unlikeliest of places. Brian Skinner, a graduate student in theoretical physics at the University of Minnesota was inspired to analyze basketball after hearing a talk about the flow of traffic. Every driver wants to minimize his own commuting time instead of the average travel time for all drivers, creating a paradox where closing a road might reduce congestion by making drivers take alternative routes they would normally avoid and thus reduce the travel time for everyone. This is similar to the Patrick Ewing theory in which analysts noted that in games that Ewing did not play his team was more likely to win (despite him being known as the most talented player on the team), using diagrams similar to the traffic models.
The Future of the Game
No longer will teams rely on a single person to record every second of every game. With the invention of camera systems like SportVu, teams now have access to practically unlimited data. The program can record data on all ten players, the referees, the ball, every 30th of second. Even more, every step, dribble, pass, shot, rebound can be, “recorded, coded and categorized” (Beck). Players can use this to know what areas of their game need to be improved, and coaches can use the data to see the effectiveness of their offensive and defensive strategies. The data is also useful for medical professional who are better able to track a player’s performance once he returns from an injury, or to go back and see what caused the injury in the first place.
Conclusion
While it is difficult to get researchers to agree on how to determine a player’s efficiency they are able to agree on some key statistics that are useful. The most common statistics cited are a player’s Field Goal Attempts, Field Goal Percentage, Free Throw Attempts and Free throw percentage as other statistics all contribute to these main ones. People tend to think that the players who score the most are the best, so coaches need to find a balance between pleasing their fans and winning games. Something that they should take into consideration is increasing the playing time of players with a high number of fouls and to go for the three if down by 2 and the shot clock is off. Similarly, even if a team passes twice as fast as another taking a couple extra seconds to set up is advantageous. While the “Hot Hand” can lift a team to victory, the odds of it occurring are small and the benefits are only a couple percentage point increase. However, all of these statistics will become more vital as the game continues to improve camera technology and may alter the game of basketball as we know it.
Researchers have analyzed several theories, among them the Patrick Ewing Theory and the “Hot Hand” Theory. The Patrick Ewing phenomenon is when a team plays better without the star player in. By using alternative players the defense isn’t as prepared giving the offense an opportunity to increase their hold. Although it may seem better to have the star player takes as many shots as quickly as possible, it is advantageous to take a couple of extra seconds to set up a play to get a better quality shot. Another theory that has been examined is the “Hot Hand” Theory where a player seems to be able to make more shots simply because they are “feeling it.” While in the past researchers believed this to be a result of randomness, new technology has altered these findings which suggest that there’s a 1.2-2.4% increase in the odds of making a shot so while it may be real players should still try to avoid taking overly risky shots.
New technology is changing the face of basketball as we know it. By implementing camera systems like SportVu teams are able to record data on all ten players, the referees and the ball. The data can also be used to analyze the effectiveness of referees so the game becomes less subjective. Teams both in the NCAA and NBA have started to utilize devices like iPads to give players and coaches access to practice schedules, itineraries, scouting reports, statistics from games and practices, and videos.
Cohen, Ben. "Does the 'Hot Hand' Exist in Basketball?27." The Wall Street Journal. Dow Jones & Company, 27 Feb. 2014. Web. 24 Nov. 2014.
Cowen, Ron. "The Mathematics of Basketball." ScienceMag. AAAS, 2 Aug. 2011. Web.
Ruminski, Shawn. "Game Theory Applied to Basketball." Mind Your Decisions. N.p., 2012. Web.


