A uml use case diagram is a type of behavioral diagram defined by and created from a use case analysis. its purpose is to present a graphical overview of the functionality provided by a system in terms of actors, their goals (represented as use cases), and any dependencies between those use cases. use case diagram has only 4 major elements: the actors that the system you are describing interacts with, the system itself, the use cases, or services, that the system knows how to perform, and the lines that represent relationships between these elements.
Unified Modeling Language
Unified Modeling Language (UML) is a standardized, general-purpose modeling language in the field of software engineering. The Unified Modeling Language includes a set of graphic notation techniques to create visual models of object-oriented software-intensive systems. Although typically used in software engineering it is a rich language that can be used to model an application structures, behavior and even business processes. There are 14 UML diagram types to help you model these behaviors. They can be divided into two main categories structure diagrams and behavioral diagrams.
Activity Diagram
Component Diagram
Use Case Diagram
A UML Use Case diagram is a type of behavioral diagram defined by and created from a Use Case analysis. Its purpose is to present a graphical overview of the functionality provided by a system in terms of actors, their goals (represented as use cases), and any dependencies between those use cases. Use Case Diagram has only 4 major elements: The actors that the system you are describing interacts with, the system itself, the use cases, or services, that the system knows how to perform, and the lines that represent relationships between these elements.
Actor
 An actor
represents a role that an outsider takes on when interacting with the
business system. For instance, an actor can be a customer, a business
partner, a supplier, or another business system. Every actor has
a name.
An actor
represents a role that an outsider takes on when interacting with the
business system. For instance, an actor can be a customer, a business
partner, a supplier, or another business system. Every actor has
a name.
Association
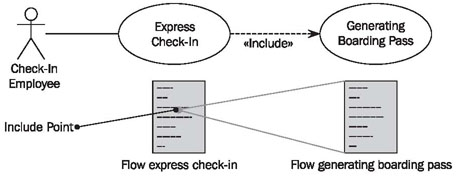
Include Relationships
CLASS DIAGRAM
Class diagrams can be used for data modeling. The classes in a class diagram represent both the main objects, interactions in the application and the classes to be programmed. Class diagrams are the most used UML diagram type. It is the main building block of any object oriented solution. It shows the classes in a system, attributes and operations of each class and the relationship between each class. In most modeling tools a class has three parts, name at the top, attributes in the middle and operations or methods at the bottom. In large systems with many classes related classes are grouped together to create class diagrams. Different relationships between diagrams are show by different types of Arrows.
Basic Class Diagram Symbols and Notations
Classes represent an abstraction of entities with common characteristics. Associations represent the relationships between classes.
Active classes initiate and control the flow of activity, while passive classes store data and serve other classes. Illustrate active classes with a thicker border.
Associations represent static relationships between classes. Place association names above, on, or below the association line. Use a filled arrow to indicate the direction of the relationship. Place roles near the end of an association. Roles represent the way the two classes see each other.
Place constraints inside curly braces {}.
Simple Constraint
Use a hollow diamond to represent a simple aggregation relationship, in which the "whole" class plays a more important role than the "part" class, but the two classes are not dependent on each other. The diamond end in both a composition and aggregation relationship points toward the "whole" class or the aggregate.
Sequence Diagram
Sequence diagrams describe interactions among classes in terms of an exchange of messages over time.
Basic Sequence Diagram Symbols and Notations
2) Activation
3) Messages
Messages are arrows that represent communication between objects. Use half-arrowed lines to represent asynchronous messages. Asynchronous messages are sent from an object that will not wait for a response from the receiver before continuing its tasks.
4) Lifelines
5) Destroying Objects
6) Loops
A repetition or loop within a sequence diagram is depicted as a rectangle. Place the condition for exiting the loop at the bottom left corner in square brackets [ ].
Basic Symbols of Activity Diagram:
1) Action states
Action states represent the no interruptible actions of objects. You can draw an action state in Smart Draw using a rectangle with rounded corners.
2) Action Flow
3) Object Flow
4) Initial State
A filled circle followed by an arrow represents the initial action state.
5) Final State
6) Branching
7) Synchronization
A synchronization bar helps illustrate parallel transitions. Synchronization is also called forking and joining.
8) Swimlanes
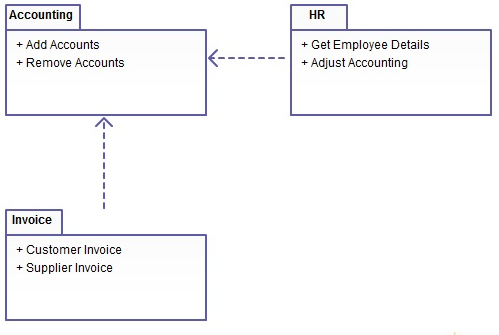
Component Diagram
A Component Diagram describe the component of the system and there relation.
2) Interface
An interface describes a group of operations used or created by components.
4) Dependencies:
Draw
dependencies among components using dashed arrows.
Object Diagram
Basic Object Diagram Symbols and Notations
2) Object attributes
As with classes, you can list object attributes in a separate compartment. However, unlike classes, object attributes must have values assigned to them.
3) Active object
4) Multiplicity
5) Links
Links are instances of associations. You can draw a link using the lines used in class diagrams.
6) Self-linked
Deployment diagrams are the design of physical resources in a system including nodes, components, and connections.
Basic Deployment Diagram Symbols and Notations
1) Component
2) Association
3) Components and Nodes
Place components inside the node that deploys them.
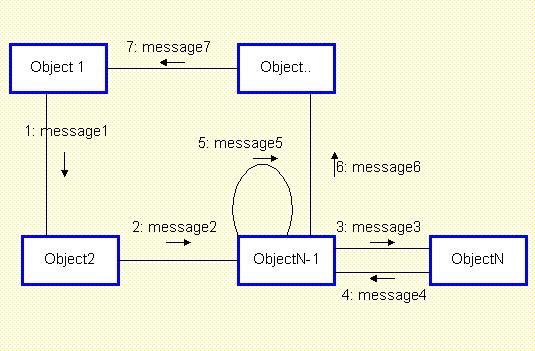
Basic Collaboration Diagram Symbols and Notations
Class roles describe how objects behave. Use the UML object symbol to illustrate class roles, but don't list object attributes.
2) Association roles
3) Messages