

Bolt Length Analysis Homework Answers Needed
Your Question:
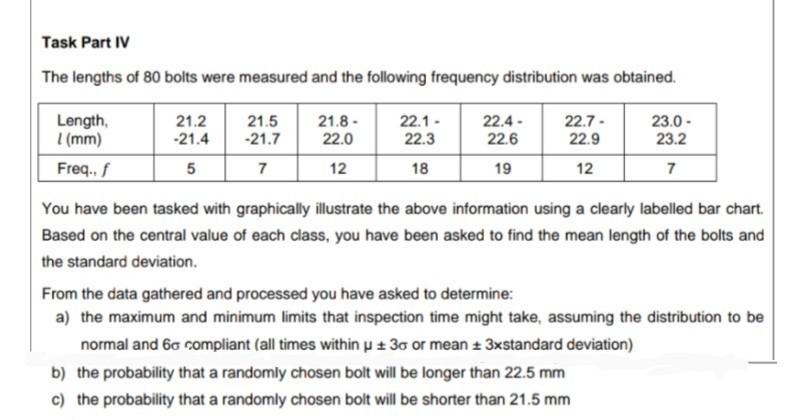
You have been tasked with graphically illustrate the above information using a clearly labelled bar chart. Based on the central value of each class, you have been asked to find the mean length of the bolts and the standard deviation.
From the data gathered and processed you have asked to determine:
a) the maximum and minimum limits that inspection time might take, assuming the distribution to be normal and 60 compliant (all times within μ ± 30 or mean ± 3xstandard deviation)
b) the probability that a randomly chosen bolt will be longer than 22.5 mm
c) the probability that a randomly chosen bolt will be shorter than 21.5 mm.
Step By Step Answers with Explanation
To create a bar chart for the given frequency distribution, we first need to calculate the midpoint of each class interval. Then, we can plot the frequencies on the y-axis and the midpoint values on the x-axis. Here's how you can do it:
Class Interval (mm) | Midpoint (mm) | Frequency (f)
22.1 - 22.3 | 22.20 | 18
22.4 - 22.6 | 22.50 | 19
Frequency (f)
20 |
10 |
8 |
21.4 21.7 22.0 22.3 22.6 22.9 23.2
```
Mean (μ) = 1784.95 / 80
Mean (μ) = 22.311875 mm (approximately)
Variance (σ²) ≈ 0.1853 mm² (approximately)
Now, calculate the standard deviation:
Minimum limit = μ - 3σ = 22.311875 - 3 0.4301 ≈ 20.921 mm
So, inspection time might take between approximately 20.921 mm and 23.702 mm.
So, the probability that a randomly chosen bolt will be longer than 22.5 mm is approximately 66.64%.
c) The probability that a randomly chosen bolt will be shorter than 21.5 mm can be calculated similarly:


