5- identify 3 additional industry-specific benchmarks the hotel could use in their comparative analysis
BIZ201 ACCOUNTING FOR DECISION MAKING
Contents
3- Comment on how the business is performing comparing to the industry 4
4- Using the results of the Ratio Analysis in Excel, comment on Profitability, Efficiency, Liquidity and Solvency of the business. With reference to the industry data provided, make recommendations when appropriate 10
2- Statement showing Vertical analysis of Income Statement 16
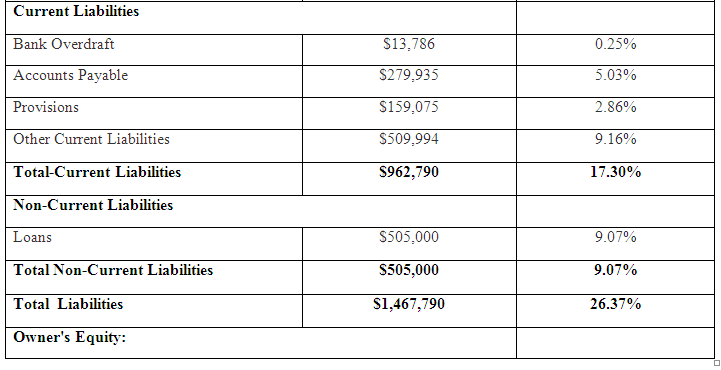
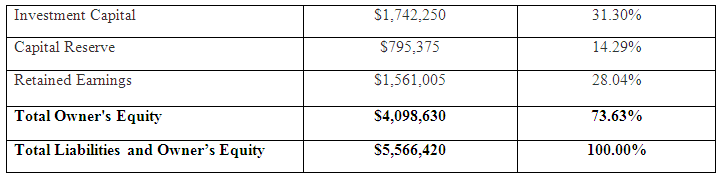
3- Statement showing Vertical analysis of Statement of financial position 18
PART 1
1- Vertical analysis of financial statements
2- Conduct Ratio Analysis using Ratio Analysis
PART 2
3- Comment on how the business is performing compared to the industry
| PARTICULARS | INDUSTRY | ACTUAL (2015) | |
|---|---|---|---|
| Revenue | Percentage | Average Room Price | Percentage |
| Rooms Revenue | 65.00 % | $ 23,404.91 | 61.88 % |
| Food and Beverage Revenue | 25.00 % | $ 5,470.19 | 14.46 % |
| Functions | 6.00 % | $ 5,609.38 | 14.83 % |
| Other Revenue | 4.00 % | $ 3,340.58 | 8.83 % |
| Total Revenue | 100.00 % | $ 37,825.06 | 100.00 % |
| Cost of Sales | |||
| Rooms Cost of Sales | 8.00 % | $ 4,933.61 | 13.04 % |
| Food and Beverage Cost of Sales | 8.00 % | $ 4,716.48 | 12.47 % |
| Other Cost of Sales | 2.00 % | $ 786.43 | 2.08 % |
| Total Cost of Sales (excluding personnel cost) | 18.00 % | $ 10,436.51 | 27.59 % |
| Personnel Costs | |||
| Rooms | 13.00 % | $ 2,874.29 | 7.60 % |
| Food and Beverage | 11.00 % | $ 2,679.42 | 7.08 % |
| Administrative and General | 4.00 % | $ 1,739.88 | 4.60 % |
| Sales and Marketing | 1.00 % | $ 1,297.95 | 3.43 % |
| Property Management and Maintenance | 2.00 % | $ 1,009.13 | 2.67 % |
| Total Personnel Costs | 30.00 % | $ 9,600.67 | 25.38 % |
| Unallocated Operating Costs | |||
| Administrative and General | 2.00 % | $ 2,561.11 | 6.77 % |
| Sales and Marketing | 3.00 % | $ 1,169.20 | 3.09 % |
| Property Operations and Maintenance | 5.00 % | $ 1,705.09 | 4.51 % |
| Utilities | 4.00 % | $ 1,489.34 | 3.94 % |
| Total Undistributed Operating Costs | 14.00 % | 18.31 % | |
(Higgins, 2012)
Table 2 Profit and Loss based on average Room Price Range
Unallocated Operating Costs: Administrative and General expenses of Crystal Hotel Pty Ltd are at the very higher side. The main reason for this high cost can be mismanagement, higher employee turnover ratio, lack of occupancy and more fixed cost in Crystal Hotel Pty Ltd. Therefore, management of Crystal Hotel Pty Ltd is required to control their general and administrative cost. According to profit average room price range, administrative and general cost of Crystal Hotel Pty Ltd is at higher side and this shows the inadequate to result in cost management and cost control practices.
4- Using the results of the Ratio Analysis in Excel, comment on Profitability, Efficiency, Liquidity and Solvency of the business. With reference to the industry data provided, make recommendations when appropriate
| 2015 | INDUSTRY | |
|---|---|---|
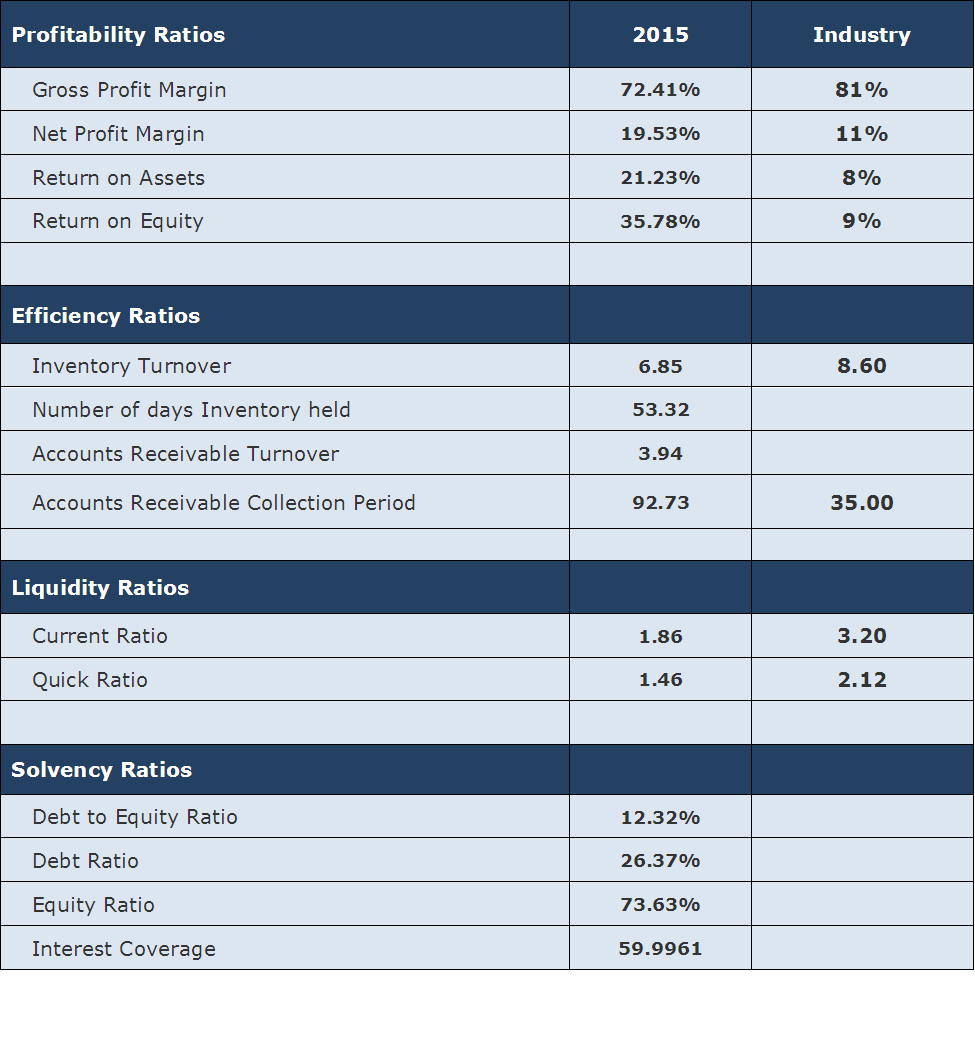
| Profitability Ratios | ||
| Gross Profit Margin | 72.41 % | 81 % |
| Net Profit Margin | 19.53 % | 11 % |
| Return on Assets | 21.23 % | 8 % |
| Return on Equity | 35.78 % | 9 % |
| Analysis: Crystal Hotel Pty Ltd has achieved a great amount of profitability from their business operations and cost control & cost management ability. From the calculation of profitability ratios, it can be analysed that Crystal Hotel Pty Ltd has not only achieved industry standards but they have shown strong profits. From gross profit margin, it can be analysed that their business operations are doing good in terms of revenue generation from sales (Putri & Handoyo, 2015). From net profit margins, it can analyse that Crystal Hotel Pty Ltd has efficient management that controls and manages cost very effectively. Return on assets and return equity ratios show how profitable Crystal Hotel Pty Ltd is for outside stakeholders. | ||
| Efficiency Ratios | ||
| Inventory Turnover | 6.85 times | 8.60 times |
| Number of days Inventory held | 53.32 days | |
| Accounts Receivable Turnover | 3.94 times | |
| Accounts Receivable Collection Period | 92.73 days | 35 days |
| Analysis: Efficiency ratio helps stakeholders to understand the efficiency of the business organisation and these are most important ratios that outside stakeholders use for interpretation. Crystal Hotel Pty Ltd has been lacking behind in terms of inventory turnover. Inventory turnover ratio denotes time period in terms of no of times inventory is converted into sales in a year. Higher inventory turnover ratio is recommended for Crystal Hotel Pty Ltd and this ratio is lacking behind industry standards (Peirson, Brown, Easton & Howard, 2014). Same is the case with accounts receivables turnover ratio i.e. this ratio is used to analyse how many times cash is collected from debtors in a year. Again this of Crystal Hotel Pty Ltd has been lacking in industry standards and Crystal Hotel Pty Ltd is able to collect cash from their debtors only 3.94 times or 4 times in a year. This shows low efficiency in inventory and receivables management of Crystal Hotel Pty Ltd. Therefore it is recommended to increase inventory turnover ratio and receivables turnover by changing current policies and incorporate new and improved policies. | ||
| Liquidity Ratios | ||
| Current Ratio | 1.86 times | 3.20 times |
| Quick Ratio | 1.46 times | 2.12 times |
| Analysis: liquidity ratios are used to analyse liquidity in the business operations of the business organisation i.e. how much cash and cash equivalents business organisation has to replay their current or short-term obligations. In case of Crystal Hotel Pty Ltd, maintaining liquidity in business operations is one of the biggest concerns. From the analysis of current ratio and quick ratio, it can be analysed that Crystal Hotel Pty Ltd can face a shortage of cash or cash equivalents in near future. Current ratio denotes availability of current assets to replay current liabilities in the business operations (Putri & Handoyo, 2015). On the other hand, quick ratio determines the actual position of current assets for repaying liabilities. It is recommended for the management of Crystal Hotel Pty Ltd to manage account receivables and increase their inventory level. | ||
| Solvency Ratios | ||
| Debt to Equity Ratio | 12.32 % | |
| Debt Ratio | 26.37 % | |
| Equity Ratio | 73.63 % | |
| Interest Coverage | 59.99 times | |
| Analysis: Solvency position of any business organisation can be measured or determined by their solvency ratio. Solvency ratios help stakeholders or investors to analyse how business is solvent in terms of their capital structure. From the analysis of solvency ratios of Crystal Hotel Pty Ltd, it can be analysed that, business operations majorly depend on internal funds i.e. equity funds are majorly used by Crystal Hotel Pty Ltd as compared to outside debt. Crystal Hotel Pty Ltd has more than enough interest coverage ratio that denotes they are having enough to repay their interest expenses out of operating profits. It is recommended to Crystal Hotel Pty Ltd to use or employ more debt in their capital structure or in business operations that will help them to expand operations and efficiency. | ||
5- Identify 3 additional industry-specific benchmarks the hotel could use in their comparative analysis
Location and Ambience: Most important factor that influences the availability and success of a hotel is its locations and ambience that hotel provides to its customers. Another comparison that can be made is to start rating that hotels get from local bodies. Crystal Hotel Pty. Ltd is required to get best possible star rating in order to stand out of their competitor’s hotels.
References
Higgins, R. C. (2012). Analysis for financial management. McGraw-Hill/Irwin.
Wilson, R. M., 2015. Researching accounting education. s.l.:Routledge.
Appendices
1- Statement showing the calculation of ratios
2- Statement showing Vertical analysis of Income Statement
3- Statement showing Vertical analysis of Statement of financial position