Coordinate Systems Assignment Help

Introduction to the Coordination Systems, Graph Plotting:
Coordinate system is defined as a system which determine the position of point on a spherical surface or planner surface Changing coordinate systems is required when integrating data from different sources into a common coordinate system.
- Cartesian coordinate system
- Polar coordinate system
- Cylindrical and spherical coordinate systems
- Homogeneous coordinate system
Coordinate Systems Assignment Help By Online Tutoring and Guide Sessions at AssignmentHelp.Net
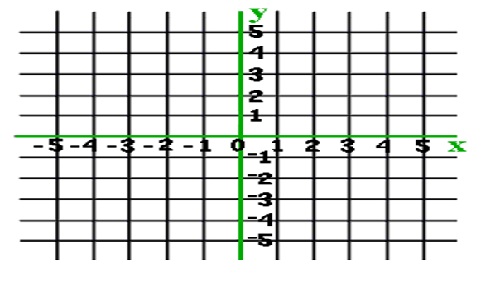
The projected coordinate system uses two axes: the x-axis, representing east-west and the y-axis, representing north-south. They intersect at the origin, (0,0). Locations are defined relative to the origin, using the notation (x,y), where x refers to the distance along the horizontal axis and y refers to the distance along the vertical axis..
A projected coordinate system inherits the components of a geographic coordinate system and also has:
Projection: The mathematical transformation used to convert from geographic coordinates to planar (projected) coordinates.
Parameters: Parameters used in the transformation. These parameters are specific to the projection.
Units: Linear measurement for coordinates on the plane.
Graph potting:
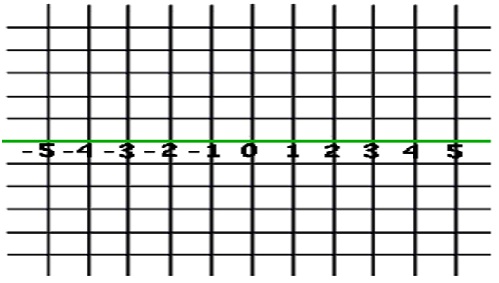
The X-axis
The X axis is the horizontal number line of the graph.
The X axis is numbered with positive coordinates on the right and negative coordinates on the left with zero in the middle.

The Y-axis
The Y axis is the vertical number line on the graph.
The Y axis is numbered with positive coordinates on the top and negative coordinates on the bottom of the X axis.

How to plot a point in coordinate system:
Before plotting points on a graph, you first have to understand the X and Y axis.
The X and Y axis are number lines that run horizontally and vertically on the coordinate system.
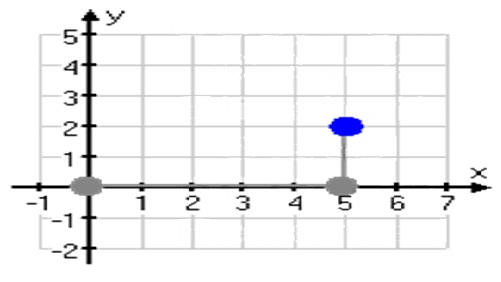
An example of a set of coordinates for a point is (5,2), which is marked with the blue dot in the coordinate system on the right.


