Multiple Regression Analysis Model Formation: Checking Significance of Independent Variables
Use the following results:
| Variable | Coefficient | Standard Error | t Statistic | p Value |
| INTERCEPT | -0.02686 | 0.06905 | -0.39 | 0.7034 |
| FOREIMP | 0.79116 | 0.06295 | 12.57 | 0.0000 |
| MIDSOLE | 0.60484 | 0.07174 | 8.43 | 0.0000 |
A. Construct a 95% confidence interval estimate of the population slope between durability and forefoot shock-absorbing capability
Step 1: The formula for creating the confidence interval for the population parameter is given as follows:
{`
Sample estimate ± tα/2 *standard error
Step 2: To calculatetα/2, use the Excel function TINV.
Go to Formulas -> More Functions -> Statistical -> TINV
`}

In the TINV dialog box, enter the probability as 0.05 and degrees of freedom as 12 (=n – 2-1)
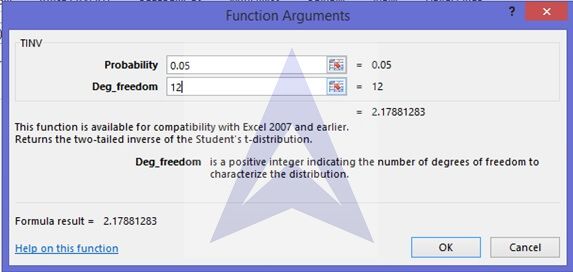
This gives the value of t12,0.05 as 2.17
Step 3: Use the formula described in Step 1 to get the confidence interval for the population slope.
{`
Confidence interval= 0.79116 ± (2.17*0.06295)
= 0.79116 ± (0.136)
= (0.655, 0.927)
`}
B. At the 0.05 level of significance, determine whether each independent variable make a significant contribution to the regression model. On the basis of these results, indicate the independent variables to include in this model.
{`
Testing significance of the variable FOREIMP (b)
Step 1: establish the null and alternate hypothesis:
Null hypothesis: H0: b=0
Alternate hypothesis: H1:b ≠ 0
Step 2: t test will be used.
α= 0.05
Step 3: Establish the decision criteria: Reject H0 when tcal > critical value
Step 4: Critical value = 2.17 	(from part A above)
tcal = 12.57			(from the regression results given)
Step 5: Since tcal > critical value, we reject the null hypothesisH0.
Thus, the variable FOREIMP makes a significant contribution to the model

Testing significance of the variable MIDSOLE (c)
Step 1: Establish the null and alternate hypothesis:
Null hypothesis: H0: c = 0
Alternate hypothesis: H1: c ≠ 0
Step 2: t test will be used.
α= 0.05
Step 3: Establish the decision criteria: Reject H0 when tcal > critical value
Step 4: Critical value = 2.167 (from part A above)
tcal = 8.43 (from the regression results given)
Step 5: Since tcal > critical value, we reject the null hypothesisH0.
Thus, the variable MIDSOLE makes a significant contribution to the model
`}
Therefore, we can conclude that both the given variable have a significant contribution to the explanatory power of the regression model. Therefore, both these variables should be included.
Excel Econometrics Tutorials
Multiple Regression Analysis
- Estimation and Inference
- Estimation, Inference & Prediction
- Model Formation: Checking Significance of Independent Variables
Time Series Analysis
- Exponential Smoothing Forecasting
- Plotting Linear Trend and Forecasting
- Monthly Data De-Trending, Seasonal Index & Forecasting
- Linear, Exponential and Quadratic Trend
- Excel Tutorial for Normal Distributions
Data Analysis
