Multiple Regression Analysis: Estimation and Inference
The business problem facing the director of broadcasting operations for a television station was the issue of standby hours (i.e. hours in which unionized graphic artists at the station are paid but are not actually involved in any activity) and what factors were related to standby hours. The study included the following variables:
Standby hours (Y)—total number of standby hours in a week
Total staff present (X¹)—Weekly total of people-days
Remote hours (X²)—Total number of hours worked by employees at locations away from the central plant
Data were collected for 26 weeks; these data are organized and stored in Standby.
Step 1
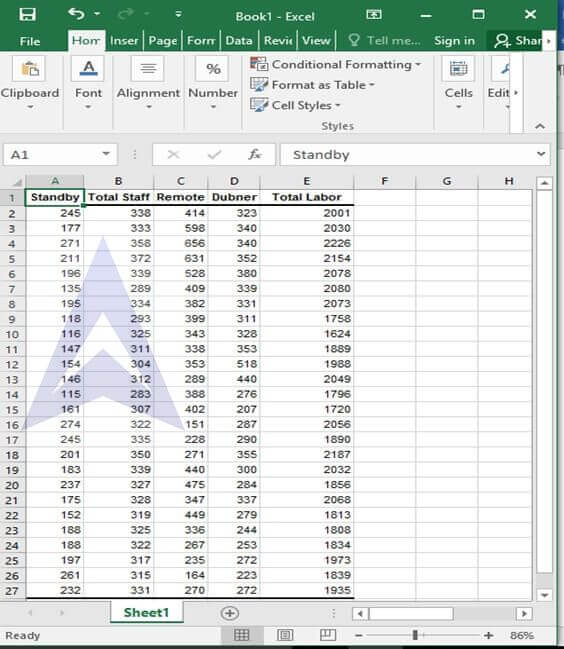
Copy data on to an excel sheet.
| Standby | Total Staff | Remote | Dubner | Total Labor |
|---|---|---|---|---|
| 245 | 338 | 414 | 323 | 2001 |
| 177 | 333 | 598 | 340 | 2030 |
| 271 | 358 | 656 | 340 | 2226 |
| 211 | 372 | 631 | 352 | 2154 |
| 196 | 339 | 528 | 380 | 2078 |
| 135 | 289 | 409 | 339 | 2080 |
| 195 | 334 | 382 | 331 | 2073 |
| 118 | 293 | 399 | 311 | 1758 |
| 116 | 325 | 343 | 328 | 1624 |
| 147 | 311 | 338 | 353 | 1889 |
| 154 | 304 | 353 | 518 | 1988 |
| 146 | 312 | 289 | 440 | 2049 |
| 115 | 283 | 388 | 276 | 1796 |
| 161 | 307 | 402 | 207 | 1720 |
| 274 | 322 | 151 | 287 | 2056 |
| 245 | 335 | 228 | 290 | 1890 |
| 201 | 350 | 271 | 355 | 2187 |
| 183 | 339 | 440 | 300 | 2032 |
| 237 | 327 | 475 | 284 | 1856 |
| 175 | 328 | 347 | 337 | 2068 |
| 152 | 319 | 449 | 279 | 1813 |
| 188 | 325 | 336 | 244 | 1808 |
| 188 | 322 | 267 | 253 | 1834 |
| 197 | 317 | 235 | 272 | 1973 |
| 261 | 315 | 164 | 223 | 1839 |
| 232 | 331 | 270 | 272 | 1935 |
Step 2
Go to data and select the data analysis add in. Click on it and select regression.

Step 3
- Select A1 to A27 as y range and B1 to E27 as x range. Click on label so that it can automatically take the first cell of every column as a label and doesn’t produce error results.
- Click ok to proceed
- You will find the following table:
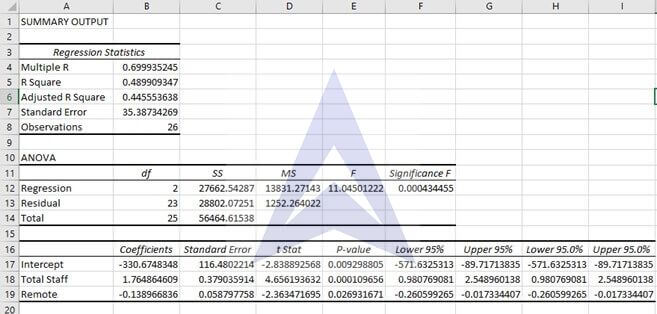
Now we can answer the question using the table:
A. State the multiple regression equation
From the results obtained we can write the regression equation as follows:
{`
  Y = -330.831 + 1.76X1 – 0.13X2
  Where,
  Y= standby hours
  X1= Total staff present
  X2= Remote hours
  b0= -330.67
  b1= 1.76
  b2= -0.13
  `}
B. Interpret the meaning of the slopes, b¹ and b², in this problem
The slope b1 means that with a 1 unit increase in total staff present the standby hours increase by 1.76 units.
The slope b2 means that if 1 unit of change is seen in remote hours then the standby hours would decrease by 0.13 units.
Thus we can conclude that standby hours are directly proportional to total staff present while remote hours and standby hours are inversely related.
C. Explain why the regression coefficient, bº, has no practical meaning in the context of this problem
The slope b0 has no practical meaning as time is never negative. And to have an intercept for time is absurd.
D. Predict the standby hours for a week in which the total staff present have 310 people-days and the remote hours are 400
{`
  Total staff present = 310
  Remote hours = 400
  Y=1.76*310 – 0.13*400
  = 493.6 hours
  `}
E. Construct a 95% confidence interval estimate for the mean standby hours for weeks in which the total staff present have 310 people-days and the remote hours are 400.
Yhat =Y± tn-2,α/2) sY
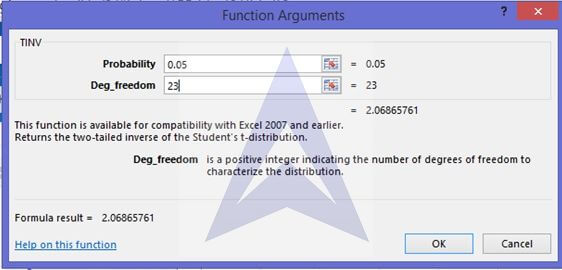
To calculate t α/2 select the function TINV in excel and put α =0.05 while degree of freedom as 23 (=n-2-1).
{`
  t23,0.05 = 2.06
  Yhat = 493.6 + (2.06*35.38)
  = 566.27
  Or Yhat = 493.6 - (2.06*35.38)
  = 420.93
  Confidence interval = (420.93, 566.27)
  `}
Excel Econometrics Tutorials
Multiple Regression Analysis
- Estimation and Inference
- Estimation, Inference & Prediction
- Model Formation: Checking Significance of Independent Variables
Time Series Analysis
- Exponential Smoothing Forecasting
- Plotting Linear Trend and Forecasting
- Monthly Data De-Trending, Seasonal Index & Forecasting
- Linear, Exponential and Quadratic Trend
- Excel Tutorial for Normal Distributions
Data Analysis
