Economic Analysis of Project Proposal Sample
EVALUATION OF PROJECT PROPOSALS
The main objective of this analysis is to ascertain the financial and economic viabilities of the two proposals. The estimated capital cost of each of these proposalsis is $40 billion (bn). Other details are provided below.
PROPOSAL A
Financial
Proposal A envisages generation of electricity from water - a hydro-electric project. The useful economic life of this project is estimated to be 60 years. This project will generate 50,000 million (mn) units of electricity annually. Electricity will be sold to the public at a tariff of 10 cents per unit. The annual operation and maintenance costs are expected to be 2.5 percent of the capital cost.
Economic (Social)
The economic (social) costs and benefits for this project must be estimated from Figure 1.
PROPOSAL B
Financial
Proposal B is a thermal project - electricity will be generated from coal. The annual operating costs for this project are estimated to be 5 percent of the capital cost. This project will also have a useful economic life of 60 years. It will generate 50,000mn units of electricity annually. The electricity from this project will be sold at 12 cents per unit.
Economic (Social)
The economic (social) costs and benefits for this project can be estimated from Figure 2.
Assumptions (common to both proposals)
- All capital costs are incurred at time t=0 (i.e., ignore project construction time).
- Electricity generated, electricity tariffs, annual costs and the discount rate remain constant throughout the economic lives of the projects.
- The economic (social) costs and benefits must be estimated exclusively from Figures 1 and 2. The costs and benefits represented in these figures are all inclusive, i.e., total costs include capital and operating costs and the demand curves reflect of all benefits provided by the projects.
- For the purpose of estimating economic (social) costs and benefits, assume that the market structure for electricity sector is currently a monopoly. It is expected to remain so for the first twenty years of the project life-span. The government however proposes to transform this market initially into an oligopoly (for the years 21 to 40) and eventually competitive (years 41-60). While it is difficult to precisely estimate the price and quantity outcomes that will prevail in an oligopoly market, the economic brains of the time have suggested that these outcomes are as shown by dotted lines in Figures 1 and 2.
- The real and apparent annual discount rates are 10 and 15 percent, respectively. Further, the economic and financial discount rates are assumed to be the same.

Figure 1 Economic (Social) Costs and Prices: Proposal A
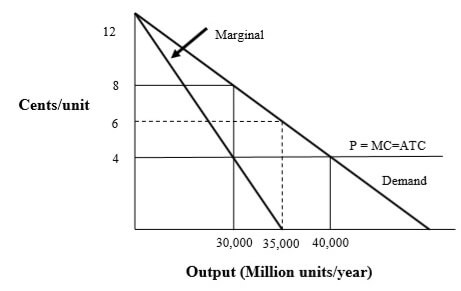
Figure 2 Economic (Social) Costs and Prices: Proposal B
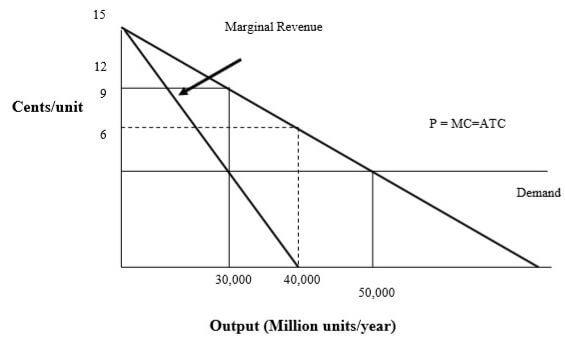
Figures 1 and 2 are Not-to-scale. Therefore, do not use these figures to estimate various areas. You should instead use values on X and Y axes to estimate various areas.
Questions
| Financial | Economic | |||
|---|---|---|---|---|
| Proposal A | Proposal B | Proposal A | Proposal B | |
| NPV | ||||
| IRR | ||||
| PB | ||||
| Life Cycle Cost | ||||
| Equivalent Annual Cost | ||||
| Consumer Surplus | ||||
| Producer Surplus | ||||
| Total Surplus | ||||
| Deadweight Loss | ||||
Note: NPV; Equivalent Annual Cost; Life Cycle Cost; and Surpluses (Consumer, Producer, and Total)and Deadweight Loss - must be rounded off to the nearest billion dollars (i.e., no decimals), and IRR and PB - to the nearest ‘whole’ percents and years (i.e., no decimals), and B/C - to one decimal point only.
- What is the basis of your calculations (the results of which are presented in the above table) – Nominal terms or Real terms?
- Which proposal will you recommend from the economy’s perspective?
- Which proposal will you recommend from the investor’s perspective?
- Which proposal will you recommend from the consumer’s perspective?
- From a financial perspective, will you select any of these projects on the basis of the indicator of Consumer Surplus?
- Will your recommendation, based on financial perspective, change if there is no inflation or deflation throughout the useful economic lives of the two projects?
- Will your recommendation, based on economic perspective, change if the opportunity cost of money is zero?
- Is there a ‘co-relation’ between ‘Total Surplus’ and ‘NPV’ (when evaluating projects from an economic perspective)?
- Is there an equivalence between the concepts of Life Cycle Cost (LCC) and Equivalent Annual Cost (EAC)?
- Will your recommendation from a financial perspective change if the funds for building the project (i.e., capital costs) are sourced from ‘equity’ as compared with ‘a loan’?
- In Figure 2, will the response of demand to changes in prices in the range of 9 to 12 cents per unit be: Elastic or Inelastic
- Will your recommendation, based on economic perspective, change if – due to unanticipated global financial turmoil – there is hyperinflation after the first ten years of the projects’ life spans?
- Will your recommendations, based on economic perspective, change if the government succeeds in converting the monopoly market, into an oligopoly market, but is unable to transform oligopoly market into a competitive market (i.e., the market stays as an oligopoly for the last 40 years of project life-spans)?
- How much subsidy (expressed in present value terms) will the government need to provide for Proposal B in order to encourage the producer to sell electricity at the competitive market prices throughout the 60 year project duration?
- Please calculate price elasticity of supply for Project A when price the price of electricity increases from 4 cents per unit to 8 cents per unit?


